-
AstroApp Financial Edition
Introduction to AstroApp Financial Edition
We have teamed up with a world-renown astrologer and financial researcher Bill Meridian to give you the first Financial Astrology Software in the Cloud.
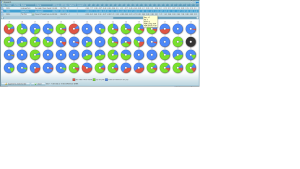
Most important features of AstroApp Financial Edition include:- Multiple techniques from Bill Meridian's Planetary Stock Trading III and IV books (planetary portfolios, price wheels, etc)
- Bill Meridian's database of First Trade charts for USA; also first trade horoscopes for the following markets: United Kingdom, UK, Netherlands, Belgium, France, Spain, Portugal, India, Canada, United Arab Emirates, Australia, and Hong Kong (more than 9,780 charts in total). Regular updates are also provided
- Bill Meridians database of Incorporation horoscopes for Abu Dhabi and Dubai markets
- Database of 18,300+ companies covering 12 countries and 15 markets
- 15,075+ first trade charts including 4,000+ ETF charts, 440+ cryptocurrency first trade charts.
- Live (intra-day and close of day) stock and ETF trading prices and volume data streams from the US, Indian, European, Canadian, Chinese and Brazilian markets with the ability to produce graphs and analyze using various transits and events data
- ~25 years of historical stocks and ETFs data for 15 markets (all US markets, India BSE, Brussel, London, Paris, Amsterdam, Lisbon, all Canadian markets all German markets, Chinese Shanghai and Shenzhen markets and a subset of Brazilian markets)
- FOREX end of day data, ability to use FOREX currency conversion data with technical indicators, astrological indicators, with all Financial Research modules.
- 157 currencies supported
- Crypto - end of day data for cryptocurrencies. Crypto currencies research using astrological indicators, technical indicators, Gann, Trading System, Research modules, etc.
- 575 crypto currencies are supported
- Bitcoin and other cryptocurrencies conversion: 463 cryptocurrencies and 156 currencies
- Cryptocurrency conversion rates and transits
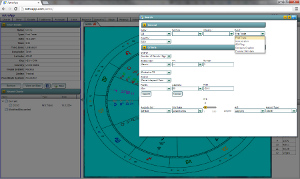
- Very advanced Financial stock charts search with complex Boolean search criteria (including result set filters like AND, NOT, Exclusive OR, etc), data sets combinations, and so on
- Financial Charts analysis/stats
- Events Analysis techniques:
- Events Charting
- Events Periods
- Events Profitability Analysis
- Portfolios. Ability to analyze portfolio charts for commonalities
- W.D Gann Planetary Support / Resistance lines
- 15 Astro Indicators
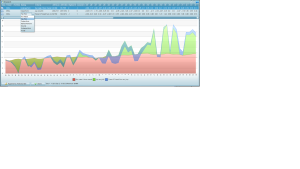
- Statistical analysis of trading prices correlations with astro significators
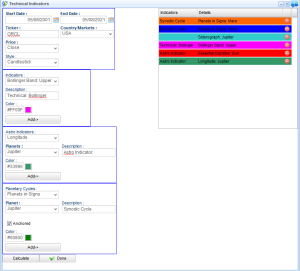
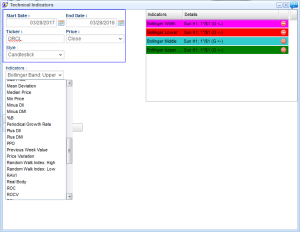
- 93 technical indicators, ability to combine multiple indicators
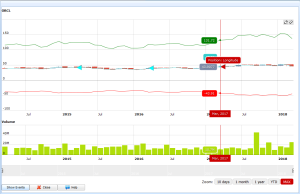
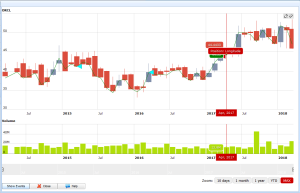
- Ability to combine technical analysis charts with Astro Events / Transits
- Advanced Trading System. Ability to define and evaluate complex trading strategies based on 22 trading rules, based on technical indicators, astro events, groups of events, astro indicators
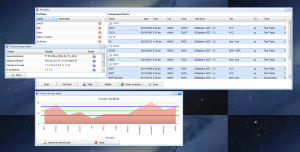
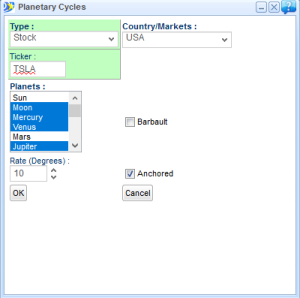
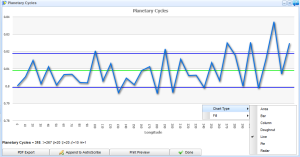
- Composite Planetary Cycles and Stocks Prices (Geocentric, Heliocentric, Topocentric)
- Planetary Cycles and Currency Exchange Rates
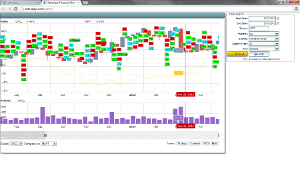
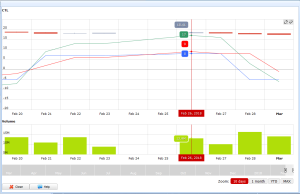
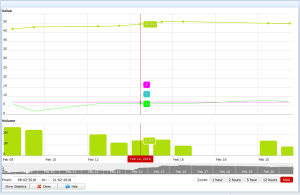
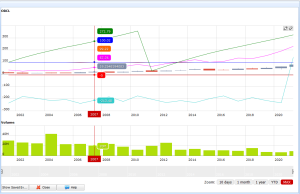
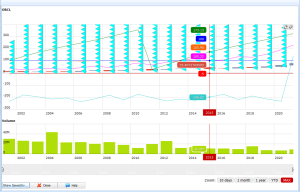
- Transits / Stock pricing / Trading Volume Graphs
- Research Module that supports research for stocks, commodities and FOREX currencies
- Research events listing, ability to export events to Excel and XML for further offline research
- Bradley Siderograph
- US Economy Activity Cycle index
- EPS - Quarterly Earnings Calendar and Transits (Earnings Announcements charts, biwheel and aspects between first trade and EPS charts)
- Market Movers Charting. Top Gainers, Top Losers, Most Traded, Biggest prices changes
- Ability to use both Tropical and Sidereal Zodiac (30+ ayanamsas) in Research and Transit modules
-
Trading System
- Ability to define Buy and Sell rules using:
- 93 Technical Indicators
- 15 Astro Indicators
- Custom Astro Events and groups of events
- Astro Events can be created using formulas of unlimited complexity
- Ability to define trading strategies based on 22 rules:
- Crossed Down Indicator
- Crossed Up Indicator
- Crossed Down Value
- Crossed Up Value
- In Pipe / Values
- In Pipe / Indicators
- In Slope / Values
- In Slope / Range
- Equal to Value
- Equal to Indicator
- Is Falling During Period
- Is Rising During Period
- Over Indicator
- Over Threshold
- Highest During Period
- Lowest During Period
- Stop Gain
- Stop Loss
- Under Indicator
- Under Threshold
- Wait
- Events
- Ability to combine multiple buy and sell rules into complex trading strategies using AND, OR, XOR, NOT operands
- Ability to analyze profitability of such trading strategies
- Ability to compare trading strategies with Buy and Hold
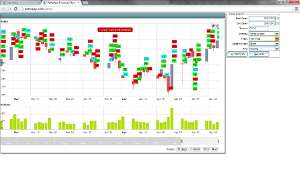
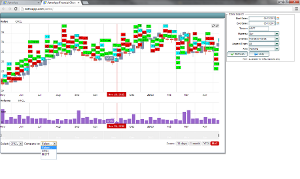
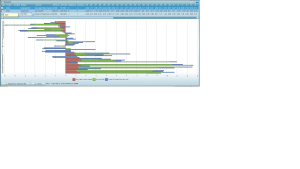
- Price charts of entry/exit events
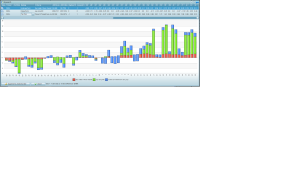
- Cash flow graphs
Trading Chart with buy and sell signal Cash Flow 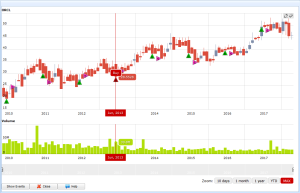
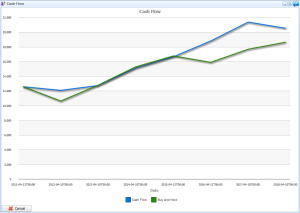
Trading Strategy Rules 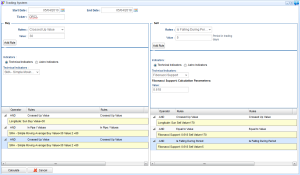
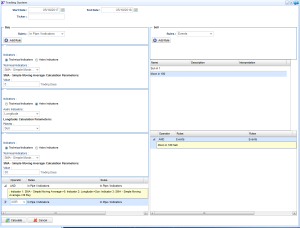
Trading Strategy Analysis 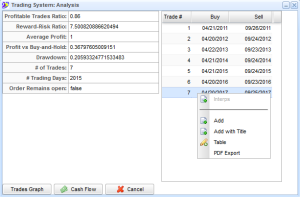
- Ability to define Buy and Sell rules using:
-
Research
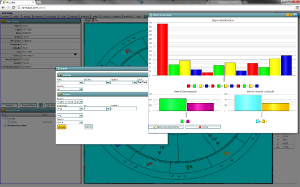
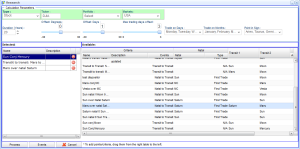
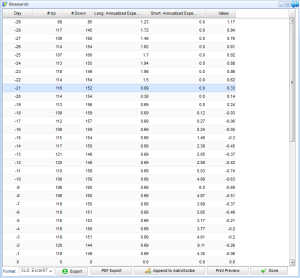
- Detailed analysis of any user-defined astrological and astronomical events
- Research price correlations between astronomical and astrological events
- Compare profitability of price correlations for different events, for individual stocks and portfolios
- Ability to merge research results to study cumulative effects.
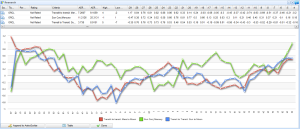
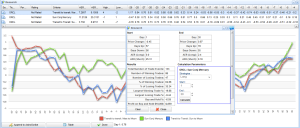
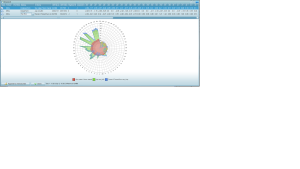
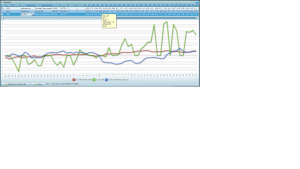
- View price correlations as tables and graphs (multiple graph types such as lines, bars, radar, areas and so on)
- Rate astronomical and astrological events
- Ability to use sidereal Zodiac, 30 predefined and also user-defined ayanamsas.
- Ability to filter buy and sell events by week days and calendar months.
- Ability to filter buy and sell events based on Zodiac Signs in which events occur
- Ability to analyze trades profitability using Long and Short strategies.
-
Strategies
- Define your investment and trading strategies based on astronomical and astrological events.
- Analyze and compare your strategies.
- Benchmark your strategies against the Buy and Hold profitability.
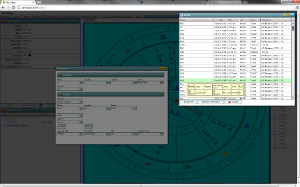
- Define Investment Strategies based on your Research analysis
Strategies module Strategies results 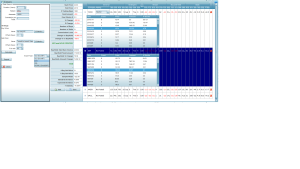
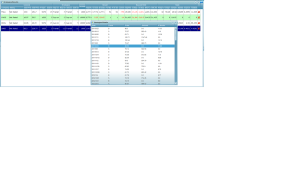
Click Image to Enlarge Click Image to Enlarge Criteria configuration 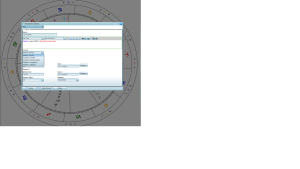
Click Image to Enlarge -
Events Analysis
- Events Analysis Module.
- Ability to analyze transit to transit events
- Ability to define most profitable buy and sell entry points
- Events Periods:
- Analysis of periodic events
- Analysis of days preceding and following astro events
- Ability to visualize price movements around astronomical and astrological events
- Events Charting:
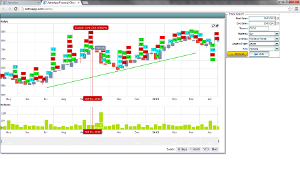
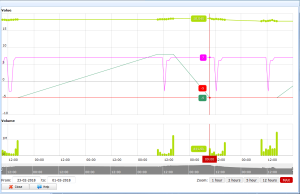
- Close of Day charting of price movements and events
- Intraday charting of price movements and events
- Ability to combine price movements, astronomical/astrological events and technical indicators
- Ability to use transit to transit and transit to natal events
- Ability to combine multiple events of various types in a single chart
Events Charting 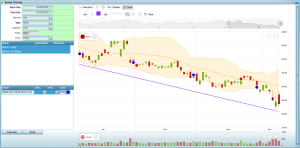
- Events Analysis Module.
-
Charts Scanning
Advanced Search for Financial charts:
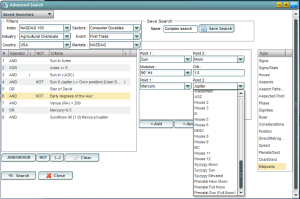
The Advanced Search module can be used to scan the first trade horoscopes database based on a huge number of criteria and criteria combinations.Search criteria can be combined into complex formulas using the following operators:
AND
OR
XOR
NOT
Additionally, you can use parentheses expressions to combine search parameters and create search criteria of unlimited complexity.
All Search Criteria can be saved and then reused with a couple of mouse clicks. -
Gann
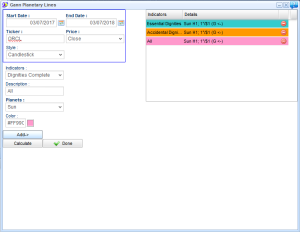
Gann Planetary Lines module:
- Classical Gann planetary support and resistance lines based on transits.
- Gann planetary support and resistance module for the First Trade charts.
- Geocentric, Heliocentric, and Topocentric calculations.
- Ability to combine different coordinates calculations for the same planets (such as Heliocentric with Geocentric).
- Ability to set the Price to Longitude scale.
- Configurable harmonic values.
- Ability to calculate Gann lines for Open, Close, High, Low, and Average daily prices.
- Clockwise and Counterclockwise longitude projections.
- Three stock chart styles: Candlestick, OHLC, and Area.
- Ability to combine and show multiple Gann planetary lines on a single chart.
- Ability to combine Heliocentric and Geocentric calculations for the same planets.
- Ability to evaluate Statistical Correlations between price movements and astro indicators.
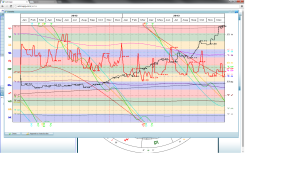
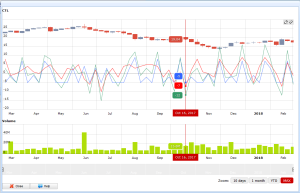
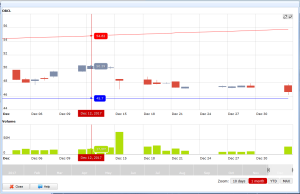
Planetary lines calculation: Planetary resistance line on the candlestick chart: 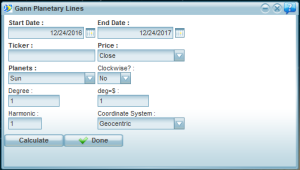
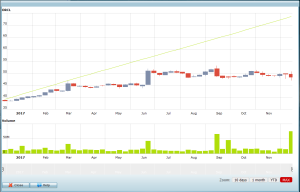
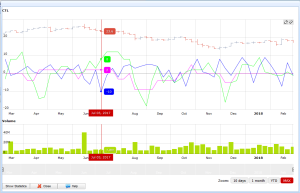
Multiple Indicators: Multiple Indicators: Zoomed in view: 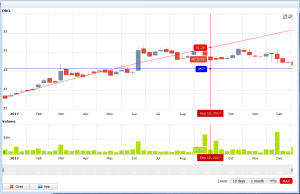
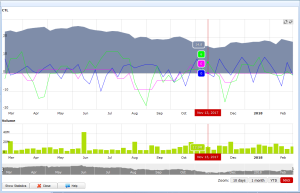
Correlation between price movements and astro indicators: 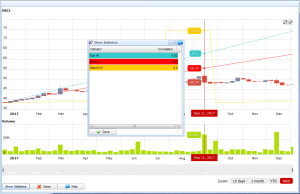
-
Astro Indicators
Astro Indicators:
- Essential Dignities
- Accidental Dignities
- Complete Dignities
- Longitude
- Latitude
- Distance (AU)
- Speed
- Speed in Latitude
- Speed in AU
Ability to use Astro Indicators with historical close of day data and intra-day data.
Statistical correlations between astro indicators and stock prices. -
Technical Indicators
Software de Astrología en línea
AstroApp es el primer programa de Astrología basado en la red.

AstroApp contiene todas las funciones de un Programa de Astrología. Avanzada y está disponible en la red. No necesitas preocuparte sobre respaldos, parches, instalación, actualizaciones o configurar tu computadora. No hay necesidad de seguir moviendo tus bases de datos cada vez que compras una computadora personal, portátil, Mac o iPad. ¡Todo lo que requieres para correr AstroApp es pasión por la astrología y tu navegador en la red!
AstroApp ofrece una amplio rango de funciones excitantes no encontradas en ninguna otra parte. Aquellos que practiquen Astrología Medieval apreciarán los algoritmos de magia medieval, Distribuciones, Profecciones y 11 tipos de Direcciones Primarias. Cartas de crisis y proyecciones anatómicas disponibles en el módulo de Astrología Médica.
AstroApp ofrece una amplio rango de funciones excitantes no encontradas en ninguna otra parte. Aquellos que practiquen Astrología Medieval apreciarán los algoritmos de magia medieval, Distribuciones, Profecciones y 11 tipos de Direcciones Primarias. Cartas de crisis y proyecciones anatómicas disponibles en el módulo de Astrología Médica.
La escuela Mesoamericana de astrología está representada por los Horóscopos Planetarios Mayas. Astrólogos Modernos disfrutarán funciones como las cartas de sección aurea, cartas de persona así como detalles de 100,000 asteroideas y más.
Con AstroApp solo te suscribes para membresía Gratis o Premium y siempre puedes renovar o terminar tu suscripción en cualquier momento. Dado que AstroApp está enteramente basado en la red, puedes correrlo en tu Mac (iMac, MacBook y más), iPad, PC y en casi cualquier dispositivo que está conectado a internet
Con AstroApp solo te suscribes para membresía Gratis o Premium y siempre puedes renovar o terminar tu suscripción en cualquier momento. Dado que AstroApp está enteramente basado en la red, puedes correrlo en tu Mac (iMac, MacBook y más), iPad, PC y en casi cualquier dispositivo que está conectado a internet


