")
-
AstroApp Financial Edition
Introduction to AstroApp Financial Edition
We have teamed up with a world-renown astrologer and financial researcher Bill Meridian to give you the first Financial Astrology Software in the Cloud.
Most important features of AstroApp Financial Edition include:- Multiple techniques from Bill Meridian's Planetary Stock Trading III and IV books (planetary portfolios, price wheels, etc)
- Bill Meridian's database of First Trade charts for USA; also first trade horoscopes for the following markets: United Kingdom, UK, Netherlands, Belgium, France, Spain, Portugal, India, Canada, United Arab Emirates, Australia, and Hong Kong (more than 9,780 charts in total). Regular updates are also provided
- Bill Meridians database of Incorporation horoscopes for Abu Dhabi and Dubai markets
- Database of 18,300+ companies covering 12 countries and 15 markets
- 15,075+ first trade charts including 4,000+ ETF charts, 440+ cryptocurrency first trade charts.
- Live (intra-day and close of day) stock and ETF trading prices and volume data streams from the US, Indian, European, Canadian, Chinese and Brazilian markets with the ability to produce graphs and analyze using various transits and events data
- ~25 years of historical stocks and ETFs data for 15 markets (all US markets, India BSE, Brussel, London, Paris, Amsterdam, Lisbon, all Canadian markets all German markets, Chinese Shanghai and Shenzhen markets and a subset of Brazilian markets)
- FOREX end of day data, ability to use FOREX currency conversion data with technical indicators, astrological indicators, with all Financial Research modules.
- 157 currencies supported
- Crypto - end of day data for cryptocurrencies. Crypto currencies research using astrological indicators, technical indicators, Gann, Trading System, Research modules, etc.
- 575 crypto currencies are supported
- Bitcoin and other cryptocurrencies conversion: 463 cryptocurrencies and 156 currencies
- Cryptocurrency conversion rates and transits
- Very advanced Financial stock charts search with complex Boolean search criteria (including result set filters like AND, NOT, Exclusive OR, etc), data sets combinations, and so on
- Financial Charts analysis/stats
- Events Analysis techniques:
- Events Charting
- Events Periods
- Events Profitability Analysis
- Portfolios. Ability to analyze portfolio charts for commonalities
- W.D Gann Planetary Support / Resistance lines
- 15 Astro Indicators
- Statistical analysis of trading prices correlations with astro significators
- 93 technical indicators, ability to combine multiple indicators
- Ability to combine technical analysis charts with Astro Events / Transits
- Advanced Trading System. Ability to define and evaluate complex trading strategies based on 22 trading rules, based on technical indicators, astro events, groups of events, astro indicators
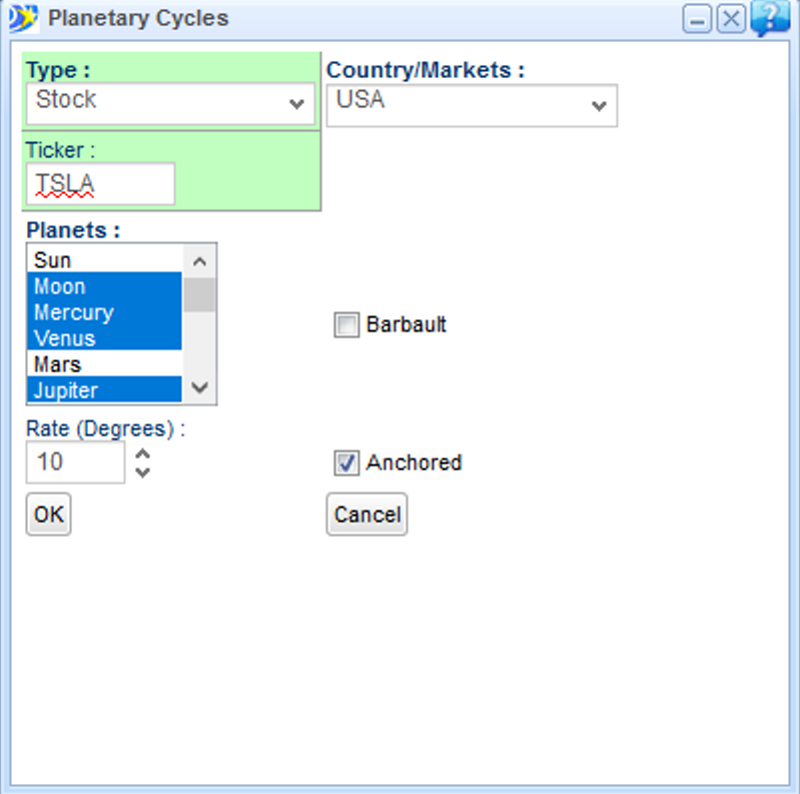
- Composite Planetary Cycles and Stocks Prices (Geocentric, Heliocentric, Topocentric)
- Planetary Cycles and Currency Exchange Rates
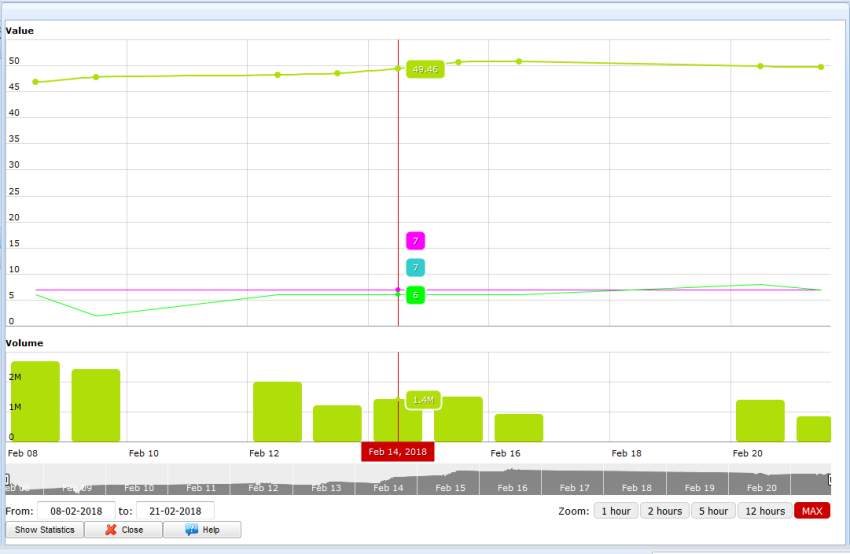
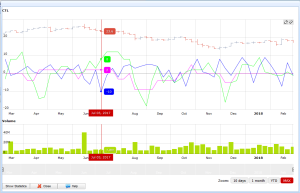
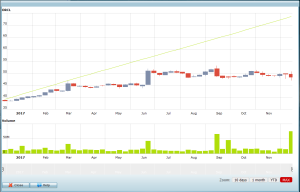
- Transits / Stock pricing / Trading Volume Graphs
- Research Module that supports research for stocks, commodities and FOREX currencies
- Research events listing, ability to export events to Excel and XML for further offline research
- Bradley Siderograph
- US Economy Activity Cycle index
- EPS - Quarterly Earnings Calendar and Transits (Earnings Announcements charts, biwheel and aspects between first trade and EPS charts)
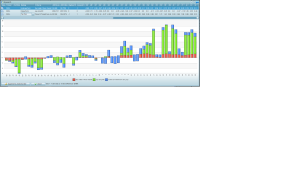
- Market Movers Charting. Top Gainers, Top Losers, Most Traded, Biggest prices changes
- Ability to use both Tropical and Sidereal Zodiac (30+ ayanamsas) in Research and Transit modules
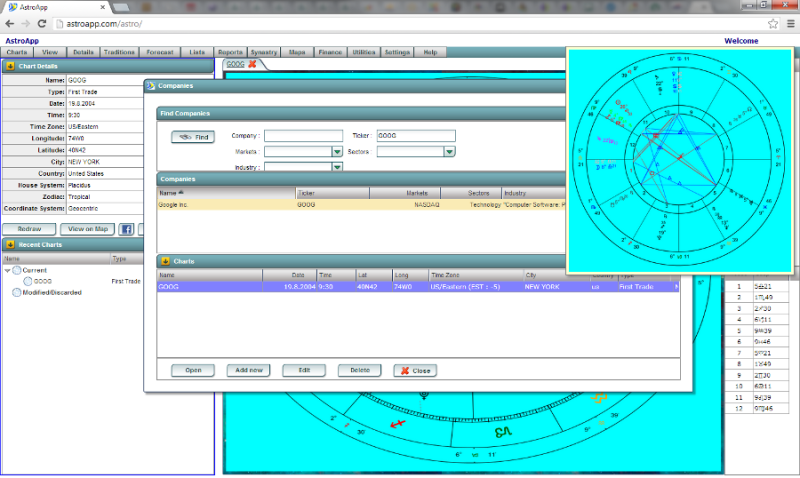
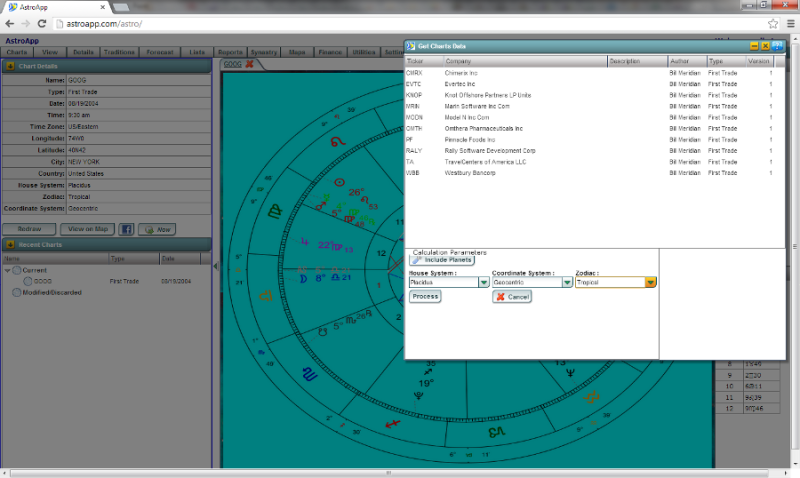
Companies Data Bill Meridian's database of First Trade charts 

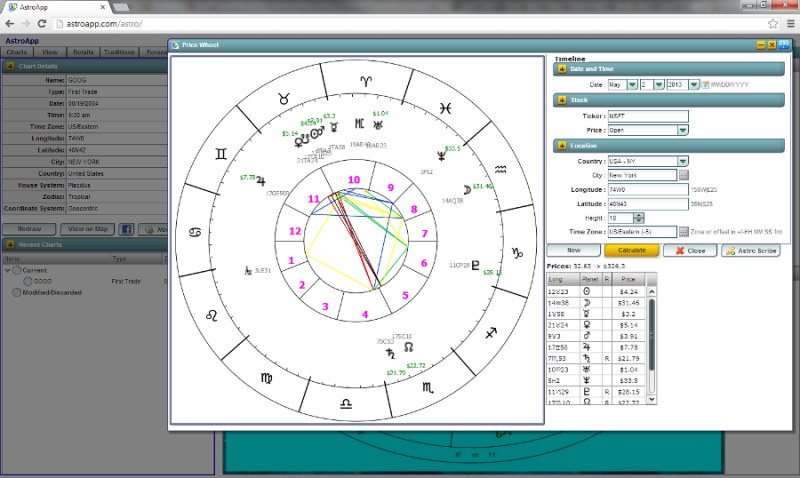
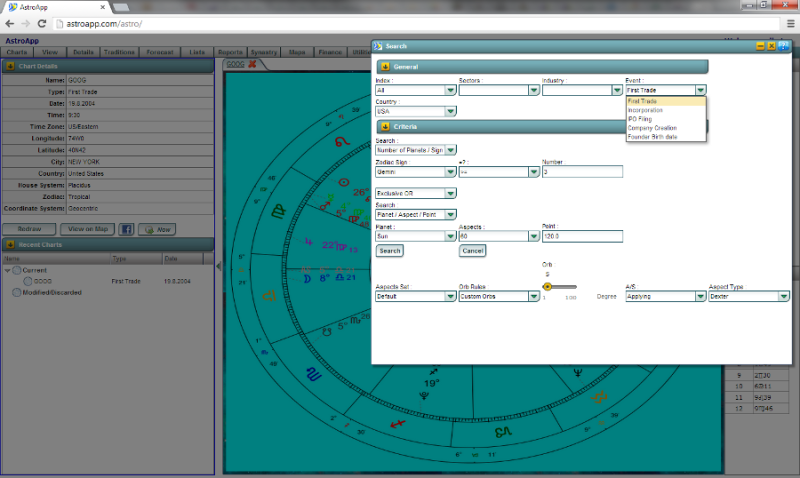
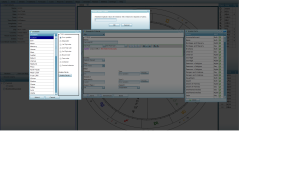
Click Image to Enlarge Click Image to Enlarge Price Wheel Comprehensive Search 

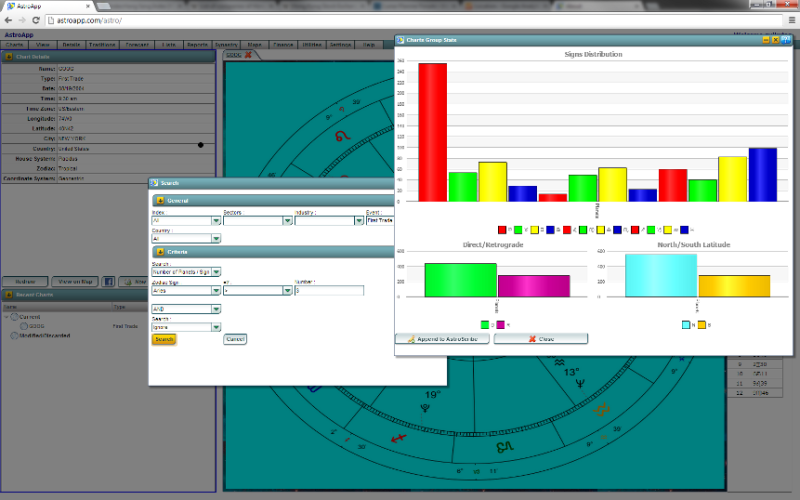
Click Image to Enlarge Click Image to Enlarge Search Results Charts Groups Analysis 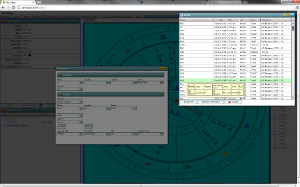

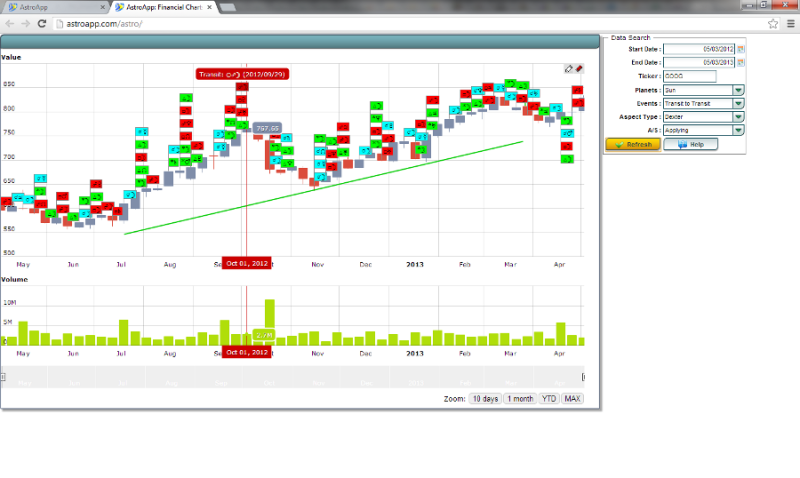
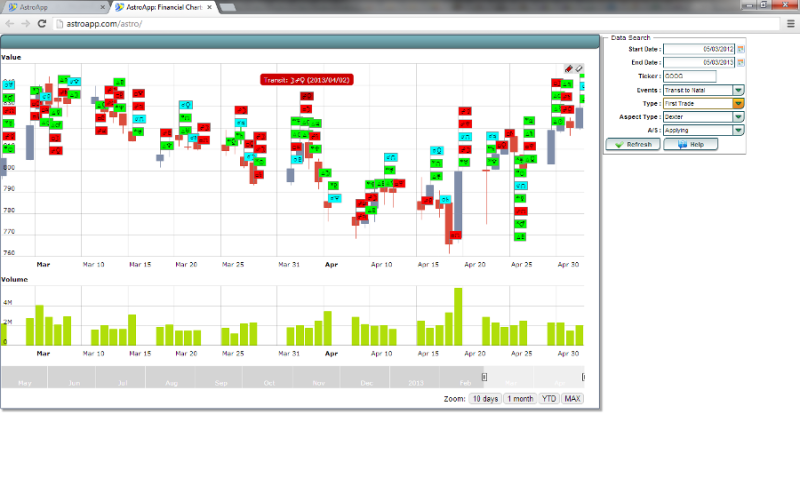
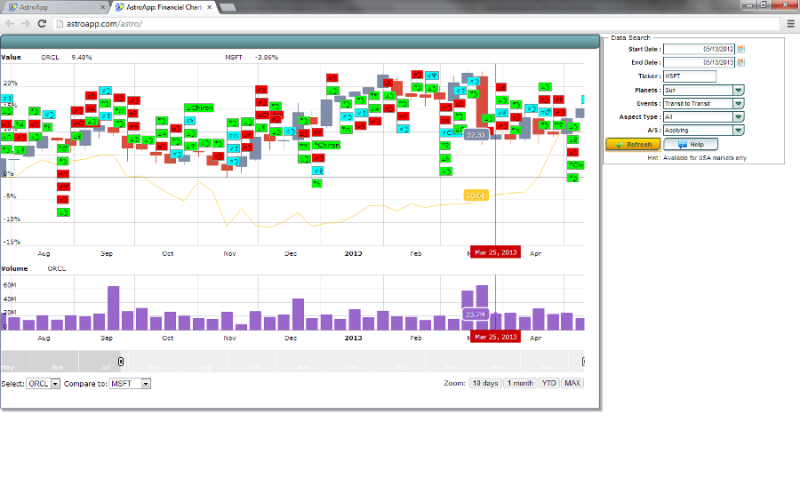
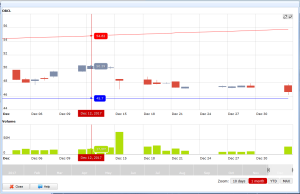
Click Image to Enlarge Click Image to Enlarge Stock Prices and Transits Stock Prices and Transits Zoom View 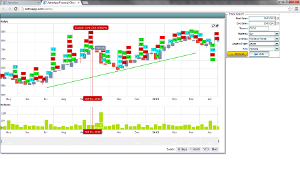
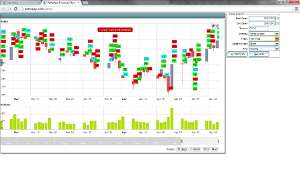
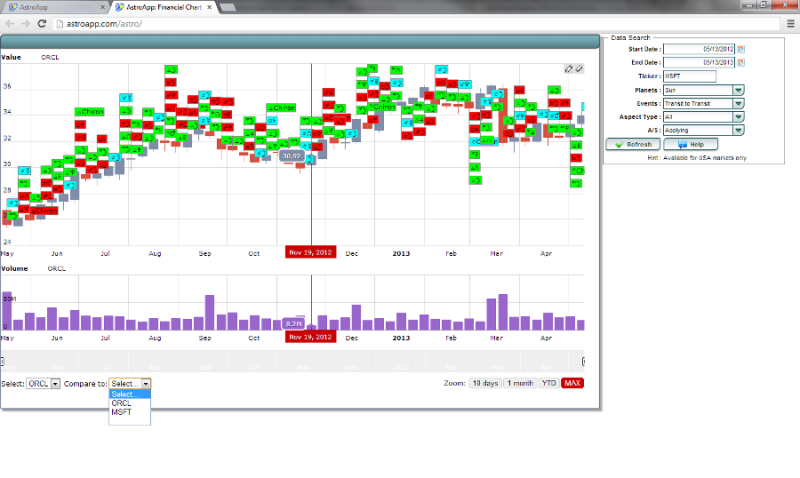
Click Image to Enlarge Click Image to Enlarge Stock Performance comparison 1 Stock Performance comparison 2 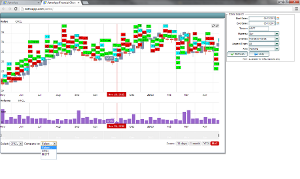

Click Image to Enlarge Click Image to Enlarge Transits, Stock Prices and Market Volatility Astrological/Astronomical Events Analysis 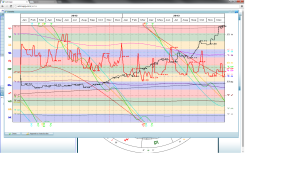
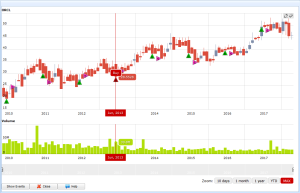
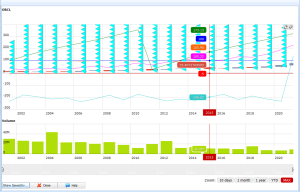
Click Image to Enlarge Click Image to Enlarge Candlestick: Astro Indicators OHLC chart with Astro Indicators 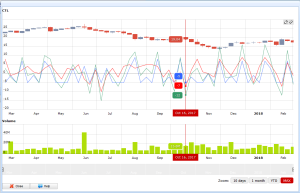
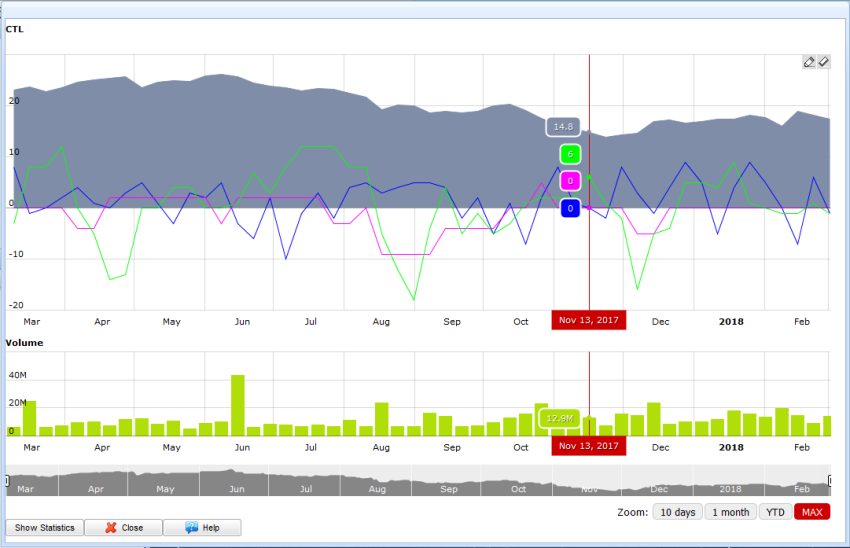
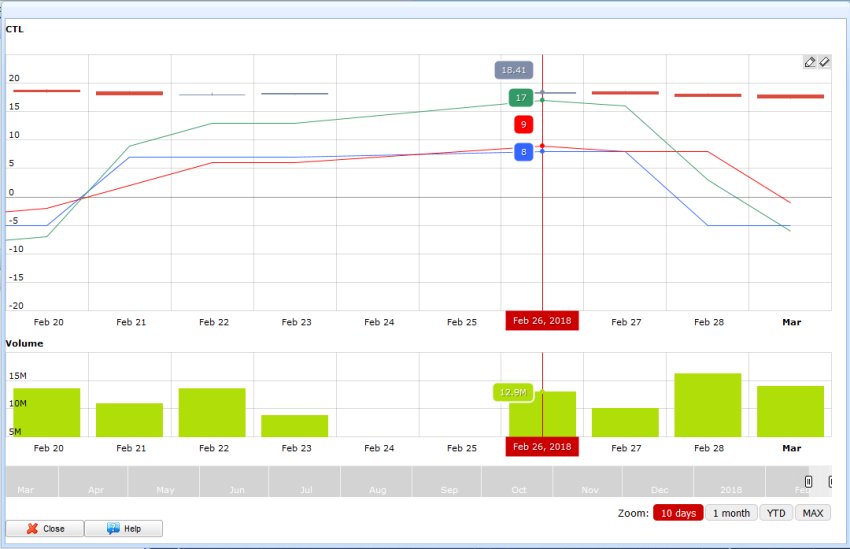
Area graph with Astro Indicators Candlestick 10 days zoom 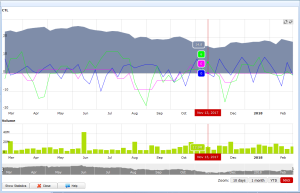

Intra Day trading with Astro Indicators Trading Strategy with Entry and Exit points 
Portfolio Astro Analysis Donald Bradley Siderograph 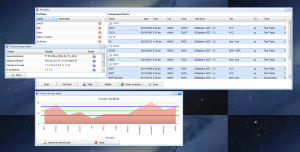
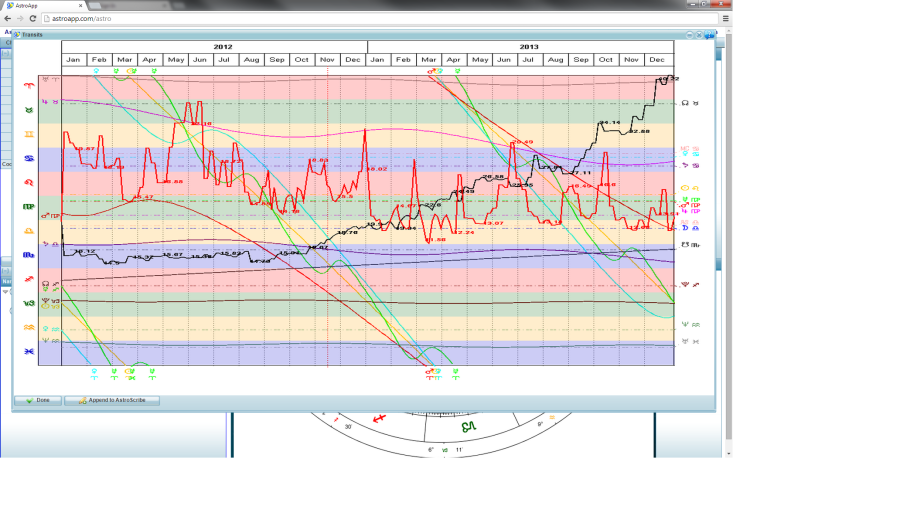
Planetary Cycles Form: Planetary Cycles and Equity Prices: 
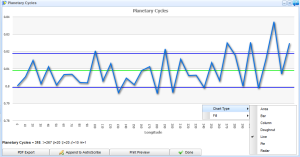
Cycles and Indicators Cycles, Indicators and Events 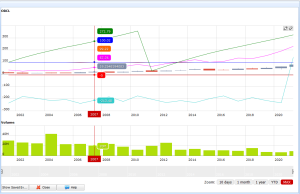
-
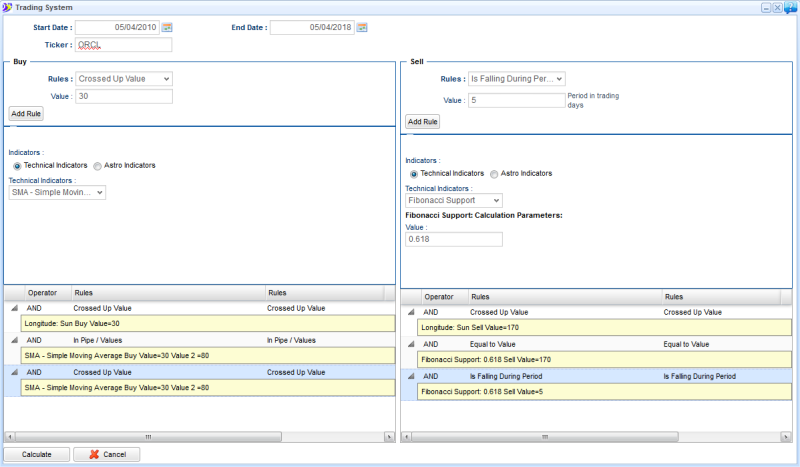
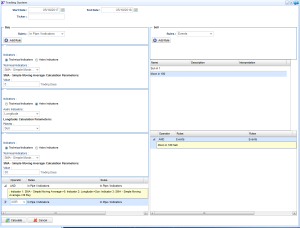
Trading System
- Ability to define Buy and Sell rules using:
- 93 Technical Indicators
- 15 Astro Indicators
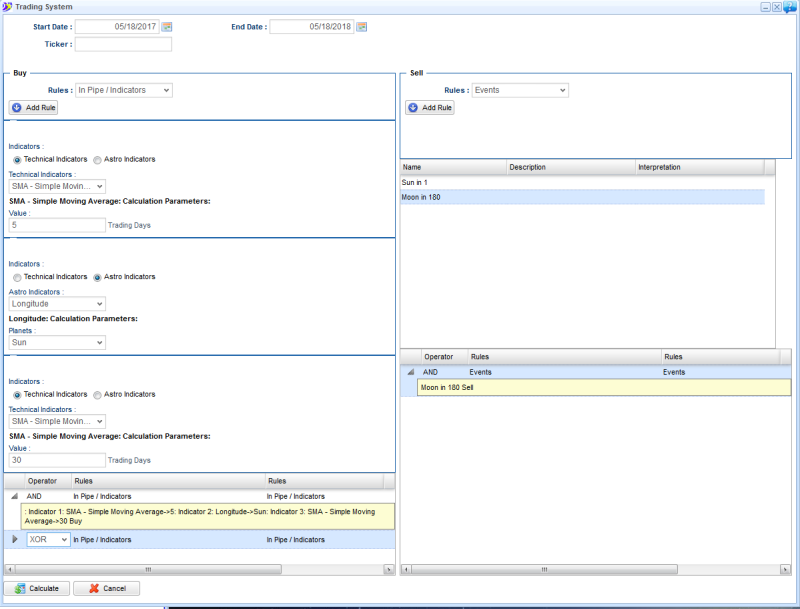
- Custom Astro Events and groups of events
- Astro Events can be created using formulas of unlimited complexity
- Ability to define trading strategies based on 22 rules:
- Crossed Down Indicator
- Crossed Up Indicator
- Crossed Down Value
- Crossed Up Value
- In Pipe / Values
- In Pipe / Indicators
- In Slope / Values
- In Slope / Range
- Equal to Value
- Equal to Indicator
- Is Falling During Period
- Is Rising During Period
- Over Indicator
- Over Threshold
- Highest During Period
- Lowest During Period
- Stop Gain
- Stop Loss
- Under Indicator
- Under Threshold
- Wait
- Events
- Ability to combine multiple buy and sell rules into complex trading strategies using AND, OR, XOR, NOT operands
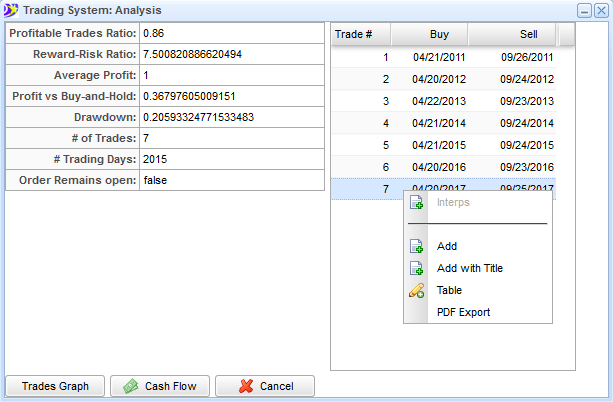
- Ability to analyze profitability of such trading strategies
- Ability to compare trading strategies with Buy and Hold
- Price charts of entry/exit events
- Cash flow graphs
Trading Chart with buy and sell signal Cash Flow 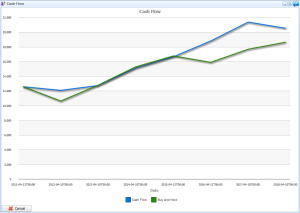
Trading Strategy Rules 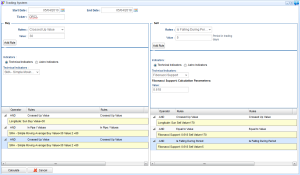
Trading Strategy Analysis 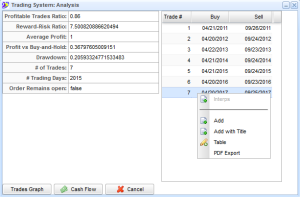
- Ability to define Buy and Sell rules using:
-
Research
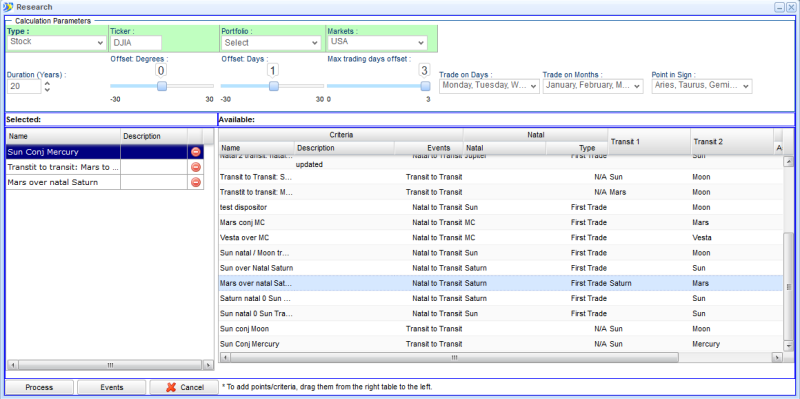
- Detailed analysis of any user-defined astrological and astronomical events
- Research price correlations between astronomical and astrological events
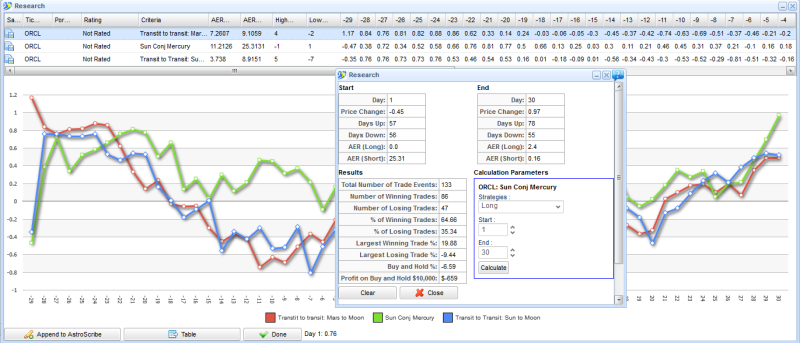
- Compare profitability of price correlations for different events, for individual stocks and portfolios
- Ability to merge research results to study cumulative effects.
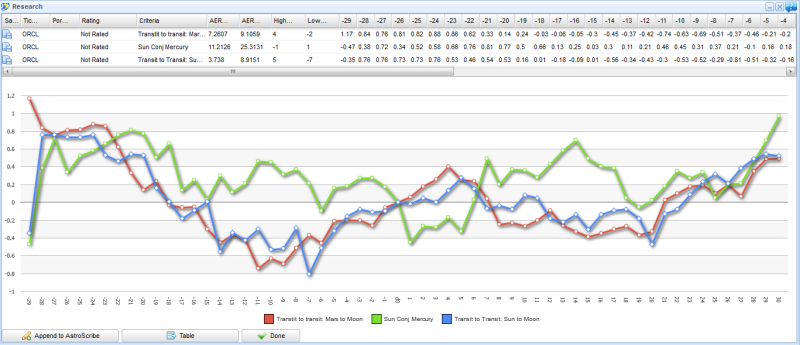
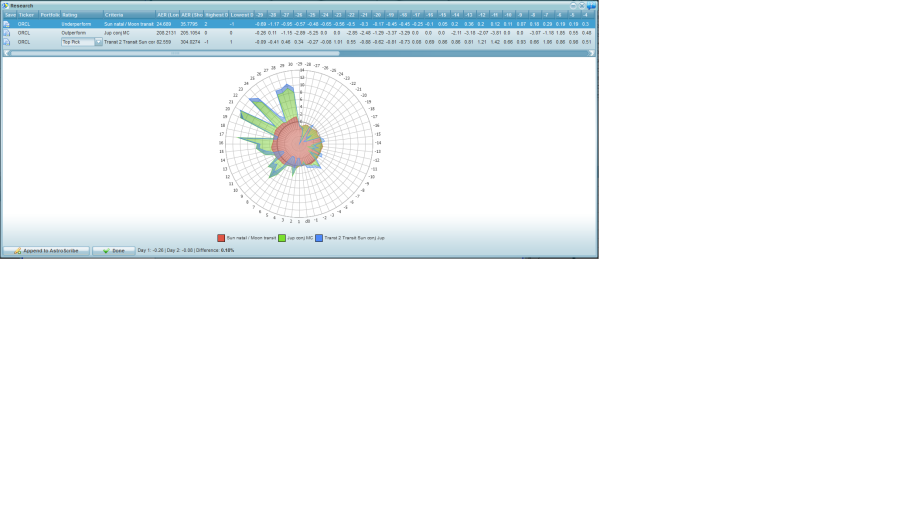
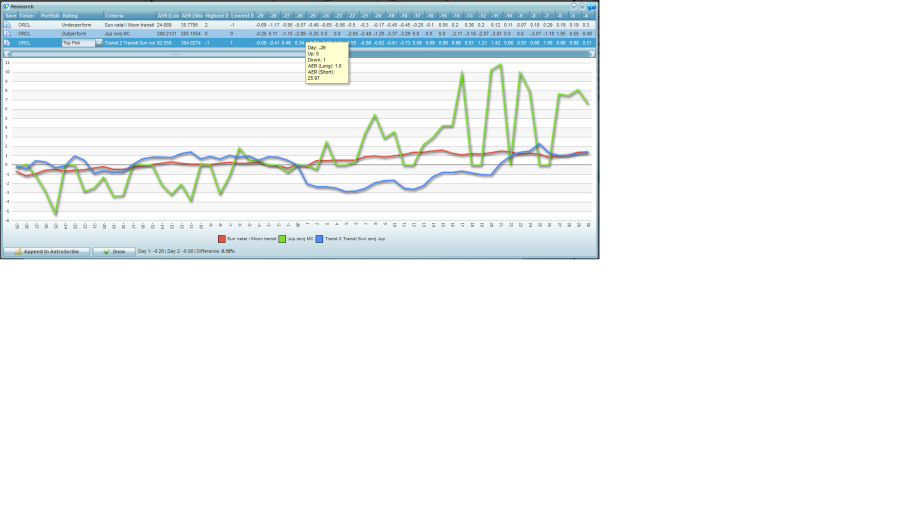
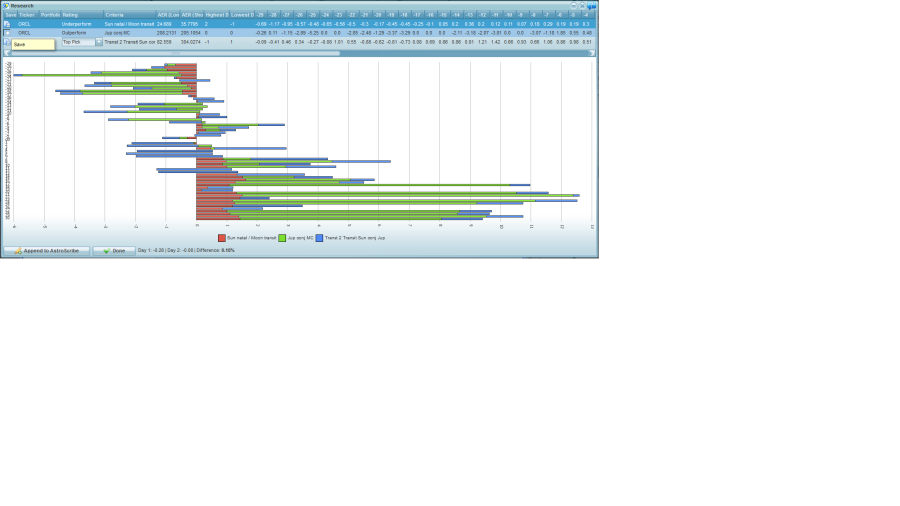
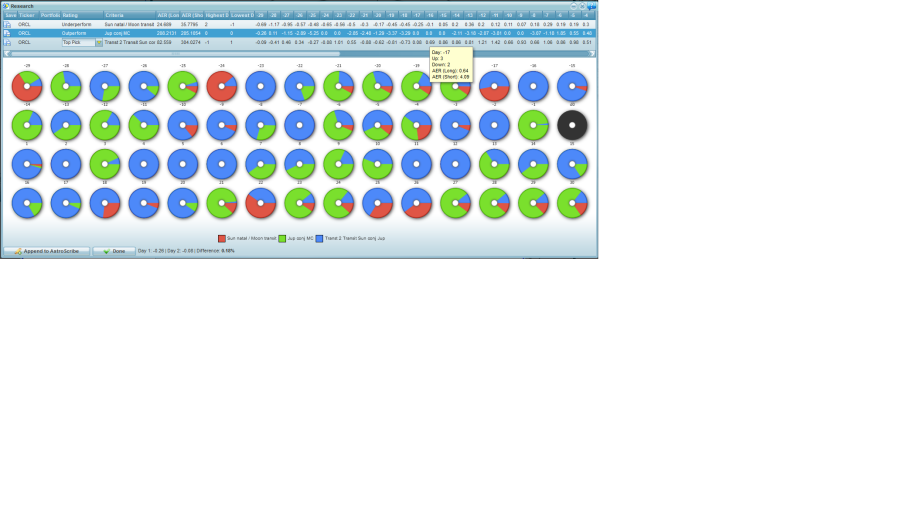
- View price correlations as tables and graphs (multiple graph types such as lines, bars, radar, areas and so on)
- Rate astronomical and astrological events
- Ability to use sidereal Zodiac, 30 predefined and also user-defined ayanamsas.
- Ability to filter buy and sell events by week days and calendar months.
- Ability to filter buy and sell events based on Zodiac Signs in which events occur
- Ability to analyze trades profitability using Long and Short strategies.
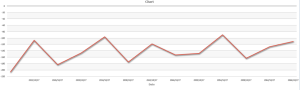
Areas graph Research: bars chart 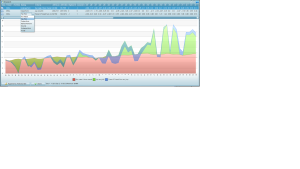
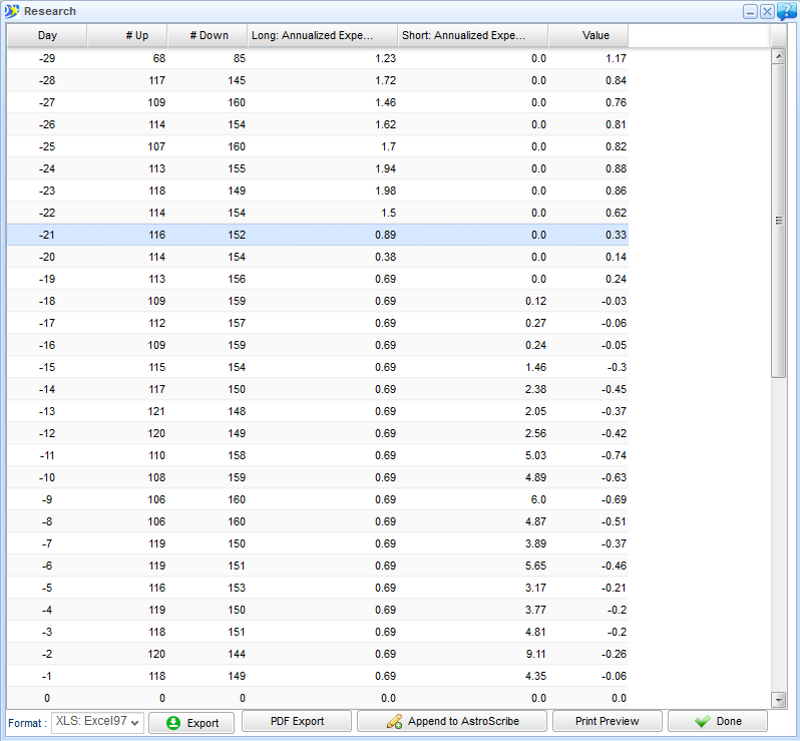
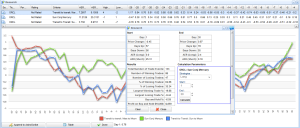
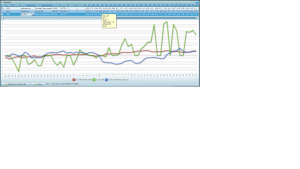
Click Image to Enlarge Click Image to Enlarge Clickable Research Graph Long and Short Trades Profitability testing 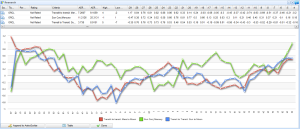
Radar graph/analysis Lines graph 
Click Image to Enlarge Click Image to Enlarge Horizontal bars and saving functionality Days stats with Doughnuts graphs 

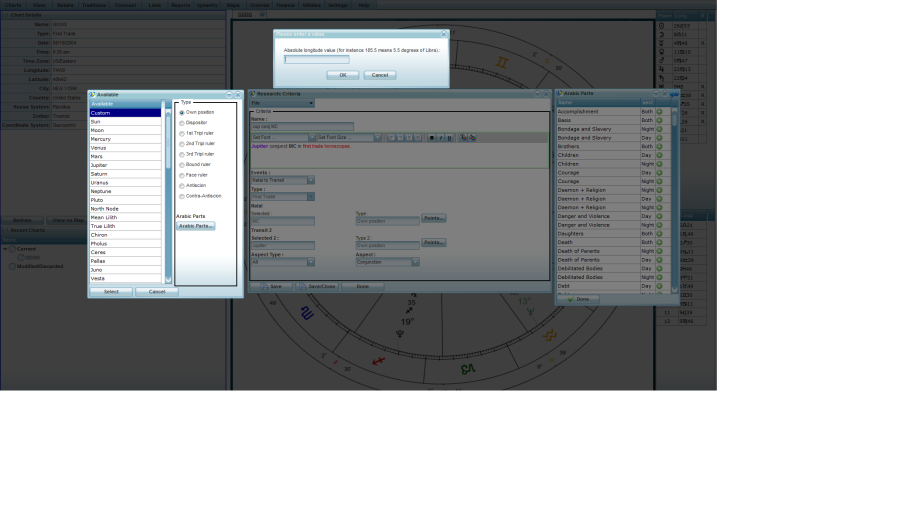
Click Image to Enlarge Click Image to Enlarge Research setup Research criteria configuration 1 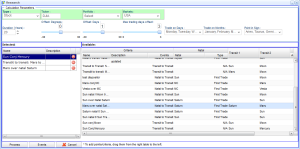
Click Image to Enlarge Click Image to Enlarge Research Results table view 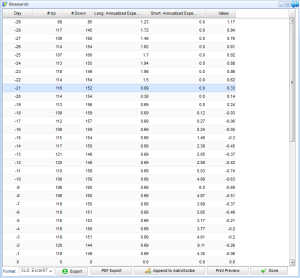
-
Strategies
- Define your investment and trading strategies based on astronomical and astrological events.
- Analyze and compare your strategies.
- Benchmark your strategies against the Buy and Hold profitability.
- Define Investment Strategies based on your Research analysis
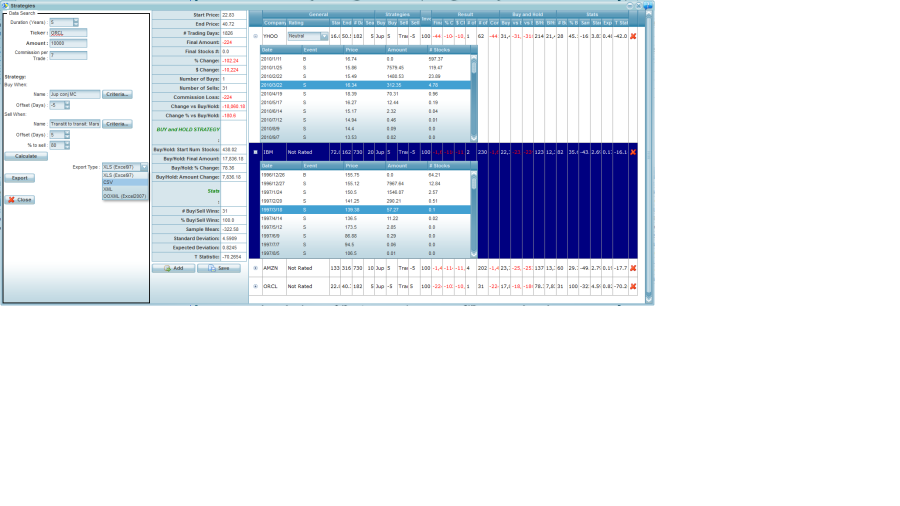
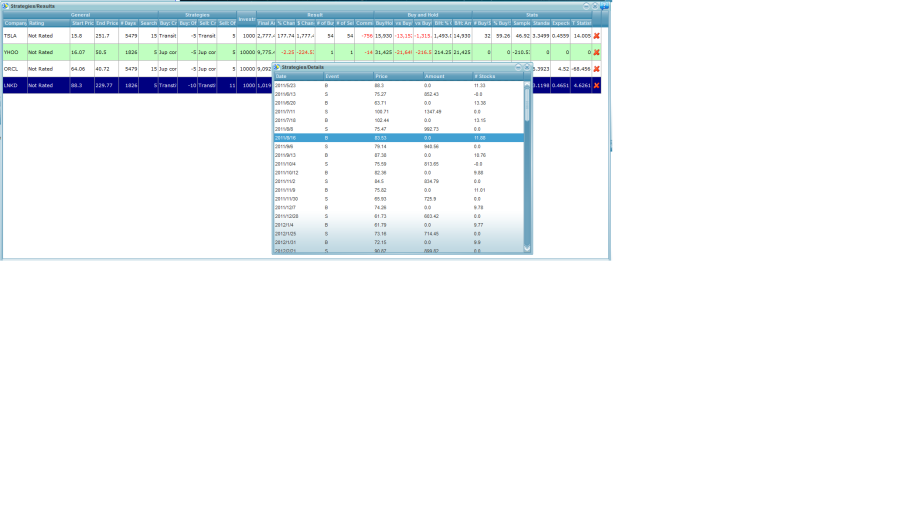
Strategies module Strategies results 

Click Image to Enlarge Click Image to Enlarge Criteria configuration 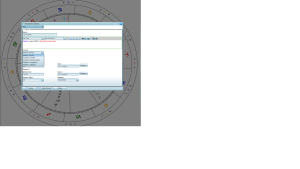
Click Image to Enlarge -
Events Analysis
- Events Analysis Module.
- Ability to analyze transit to transit events
- Ability to define most profitable buy and sell entry points
- Events Periods:
- Analysis of periodic events
- Analysis of days preceding and following astro events
- Ability to visualize price movements around astronomical and astrological events
- Events Charting:
- Close of Day charting of price movements and events
- Intraday charting of price movements and events
- Ability to combine price movements, astronomical/astrological events and technical indicators
- Ability to use transit to transit and transit to natal events
- Ability to combine multiple events of various types in a single chart
Events Charting 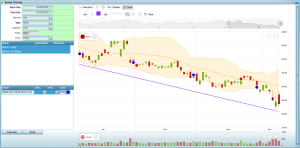
- Events Analysis Module.
-
Charts Scanning
Advanced Search for Financial charts:
The Advanced Search module can be used to scan the first trade horoscopes database based on a huge number of criteria and criteria combinations.Building first trade horoscopes scanning criteria: 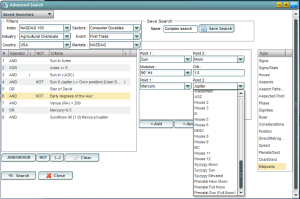
Available search criteria:
1. Sign placements (including 12 tropical signs and 13th sign Zodiac)
2. Sign stats (number of objects in signs or sign types)
3. House placements (individual houses, house types)
4. By Aspects between planets
5. By Aspects between planets and ecliptic points.
6. By Aspect Patterns (26 patterns available)
7. By phases between any objects
8. By Dignities placements
9. By rulers over specified objects.
10. By Traditional Considerations
11. By position in various coordinate systems
12. By Speed
13. By direction of the motion
14. By sect placements of planets
15. By chart sect
16. By midpoint aspects.
17. Search by IPO (first trade) dates.Search criteria can be combined into complex formulas using the following operators:
AND
OR
XOR
NOT
Additionally, you can use parentheses expressions to combine search parameters and create search criteria of unlimited complexity.
All Search Criteria can be saved and then reused with a couple of mouse clicks. -
Gann
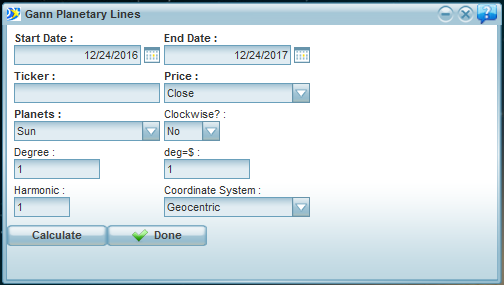
Gann Planetary Lines module:
- Classical Gann planetary support and resistance lines based on transits.
- Gann planetary support and resistance module for the First Trade charts.
- Geocentric, Heliocentric, and Topocentric calculations.
- Ability to combine different coordinates calculations for the same planets (such as Heliocentric with Geocentric).
- Ability to set the Price to Longitude scale.
- Configurable harmonic values.
- Ability to calculate Gann lines for Open, Close, High, Low, and Average daily prices.
- Clockwise and Counterclockwise longitude projections.
- Three stock chart styles: Candlestick, OHLC, and Area.
- Ability to combine and show multiple Gann planetary lines on a single chart.
- Ability to combine Heliocentric and Geocentric calculations for the same planets.
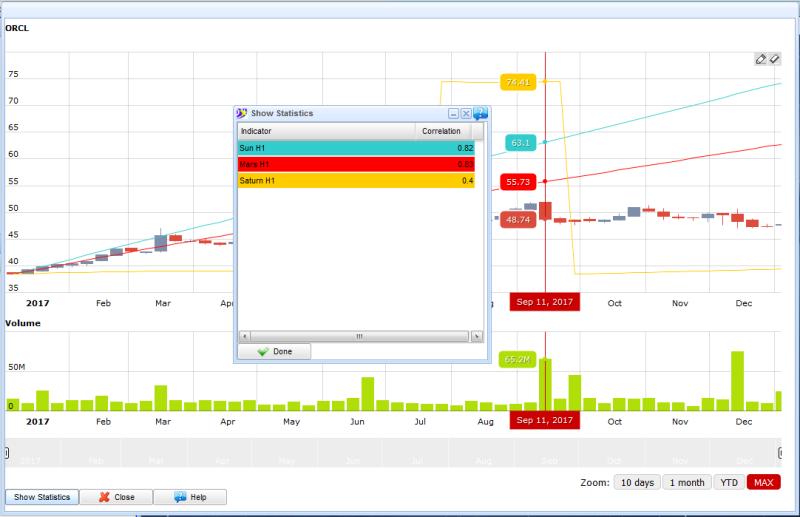
- Ability to evaluate Statistical Correlations between price movements and astro indicators.
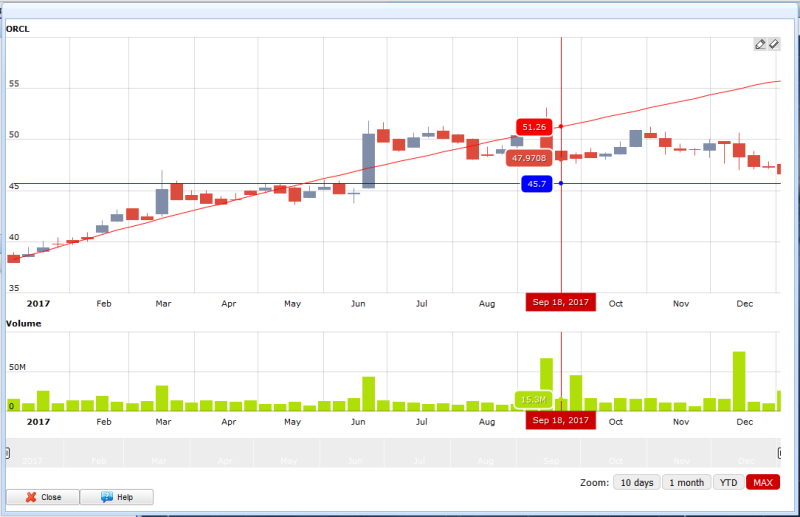
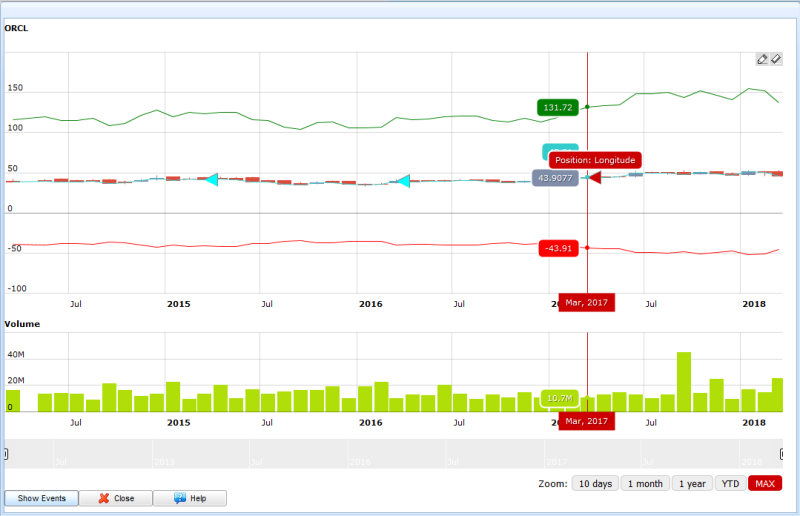
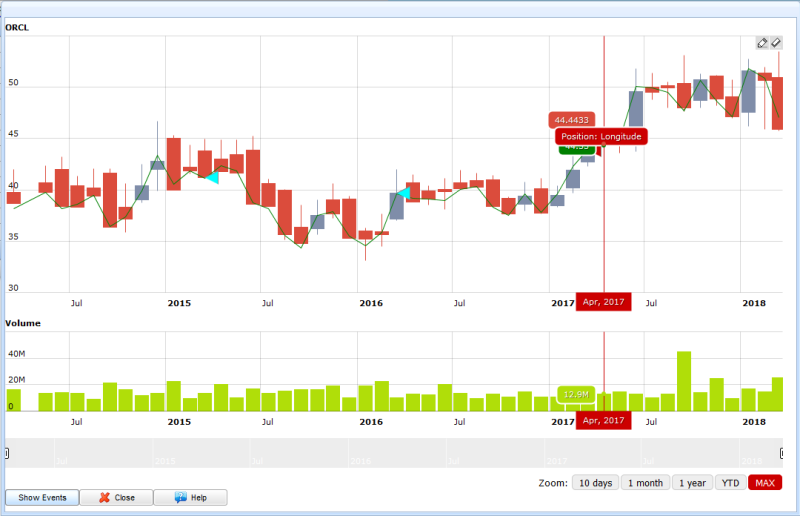
Planetary lines calculation: Planetary resistance line on the candlestick chart: 
Multiple Indicators: Multiple Indicators: Zoomed in view: 
Correlation between price movements and astro indicators: 
-
Astro Indicators
Astro Indicators:
- Essential Dignities
- Accidental Dignities
- Complete Dignities
- Longitude
- Latitude
- Distance (AU)
- Speed
- Speed in Latitude
- Speed in AU
Ability to use Astro Indicators with historical close of day data and intra-day data.
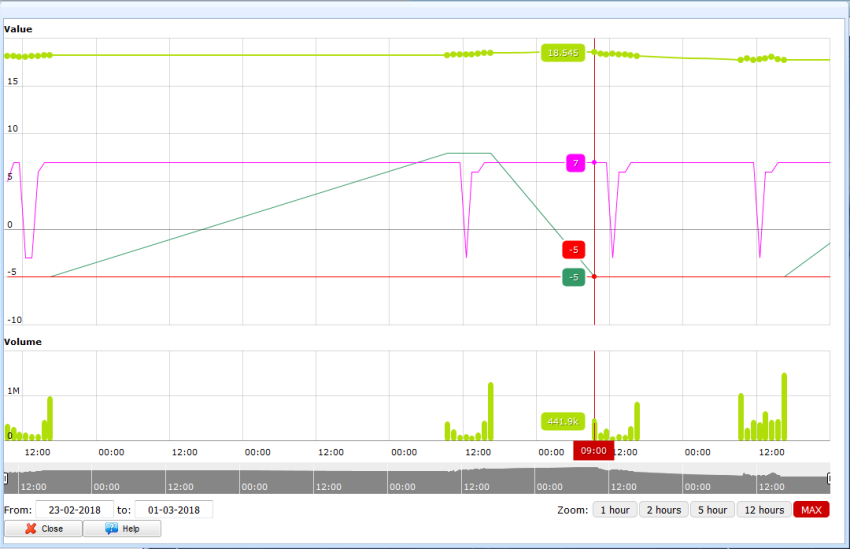
Statistical correlations between astro indicators and stock prices.Candlestick graph with Astro Indicators OHLC chart with Astro Indicators Area chart with Astro Indicators Candlestick 10 days zoom Intra Day trading with Astro Indicators Intra Day with Astro Indicators for Luminaries 
Astro Indicators selector Cycles with Astrological and Technical Indicators 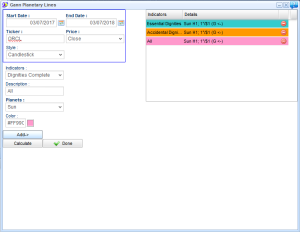
-
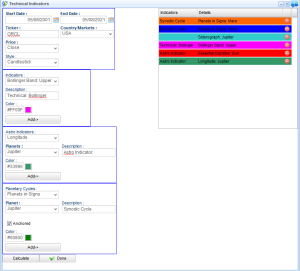
Technical Indicators
Technical Indicators
- Absolute Indicator,
- Acceleration/Deceleration,
- ADX,
- Amount,
- Aroon Down,
- Aroon Oscillator,
- Aroon Up,
- ATR,
- Awesome Oscillator,
- Bearish Engulfing,
- Bearish Haram,
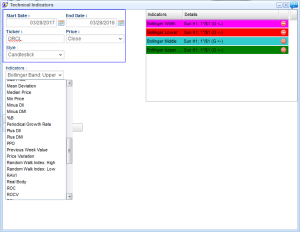
- Bollinger Band: Lower,
- Bollinger Band: Middle,
- Bollinger Band: Upper,
- Bollinger Band Width,
- Bullish Engulifing,
- Bullish Harami,
- CCI,
- Chaikin Money Flow,
- Chaikin Oscillator,
- Chandelier Exist Long,
- Chandelier Exist Short,
- Close Location Value,
- CMO,
- Coppock Curve,
- Double EMA,
- DPO,
- DX,
- Gain,
- Highest Value,
- HMA,
- Ichimoku Chikou Span,
- Ichimoku Senkou Span,
- III,
- Loss,
- Lower Shadow,
- Lowest Value,
- MACD,
- Mass Index,
- Max Price,
- Mean Deviation,
- Median Price,
- Min Price,
- Minus DII,
- Minus DMI,
- %B,
- Periodical Growth Rate,
- Plus DII,
- Plus DMI,
- PPO,
- Previous Week Value,
- Price Variation,
- Random Walk Index: High,
- Random Walk Index: Low,
- RAVI,
- Real Body,
- ROC,
- ROCV,
- RSI,
- SMA - Simple Moving Average,
- Sigma,
- Simple Linear Regression,
- Standard Deviation,
- Standard Error,
- Stochastic Oscillator DI,
- Stochastic Oscillator KI,
- Stochastic RSII,
- Three Black Crows,
- Three White Soldiers,
- TR,
- Triple EM,
- Typical Price,
- Ulcer Index,
- Upper Shadow,
- Variance,
- "VWAP,
- Williams RI,
- WMA,
- ZLEMA
- Fibonacci Support,
- Fibonacci Resistance,
- Pivot Points,
- Demark Pivot Points,
- Demark Support,
- Demark Resistance,
- Standard Pivot Point Support 1,
- Standard Pivot Point Support 2,
- Standard Pivot Point Support 3,
- Standard Pivot Point Resistance 1,
- Standard Pivot Point Resistance 2,
- Standard Pivot Point Resistance 3,
- Lowest Value
- Bearish Haram
Technical Indicators
Bollinger Bands with Astro Events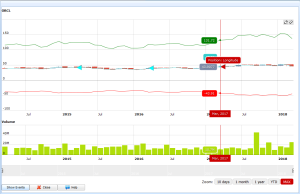
Technical Indicators with Transit
Cycles with Technical and Astrological Indicators