Financial Astrology Software for Traders
Financial Astrology for stocks, ETFs, forex and crypto: first-trade charts, prices, astro and technical indicators, a wide range of Gann techniques, George Bayer's methods, research and trading.
The Financial Gold edition brings Financial Astrology and market data together: first-trade charts for more than 15,000 securities, 25+ years of historical price data, the astrological events, cycles and indicators you can use for backtesting and price changes prediction. It was developed in collaboration with Bill Meridian and includes his first-trade charts database. You can chart a stock against its transits, test whether an event trade would have been profitable, build trading rules from technical and astrological indicators, and use a wide range of Gann techniques and George Bayer's methods. The same analysis works for ETFs, currencies and cryptocurrencies. Financial Gold also includes the tools of every other AstroApp edition.
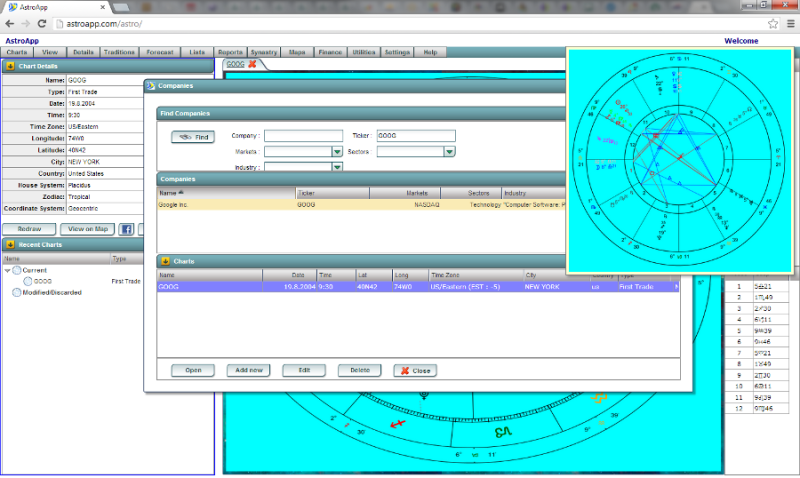
First-Trade Charts and Company Data
A first-trade chart is the chart of a security's first trade on an exchange. Bill Meridian's database of first-trade charts is at the heart of the edition, and we keep it up to date. You get:
- more than 15,000 first-trade charts for the US market and for the United Kingdom, the Netherlands, Belgium, France, Spain, Portugal, India, Canada, the United Arab Emirates, Australia and Hong Kong
- among them, more than 4,000 ETF first-trade charts and more than 440 cryptocurrency first-trade charts
- incorporation charts for the Abu Dhabi and Dubai markets
- a company database of more than 18,000 companies across 12 countries and 15 financial markets
- a calendar of upcoming and planned IPOs, with their charts
- ability to create or import your own first trade and incorporation charts data sets
Price Data
AstroApp provides historical price data, so you can compare any astro event with the actual market price movements.
- intraday and close-of-day prices and volume for stocks and ETFs on the US, Indian, European, Canadian, Chinese and Brazilian markets
- more than 25 years of history for 15 markets: the US exchanges, India's BSE, Brussels, London, Paris, Amsterdam, Lisbon, the Canadian and German markets, Shanghai and Shenzhen, and a subset of the Brazilian market
- end-of-day forex rates for more than 150 currencies
- end-of-day prices for more than 500 cryptocurrencies, and conversion rates between them and the major currencies
You can use currencies and cryptocurrencies like any other security in every research, indicator, cycle and trading module.
Charts, Indicators and Transits
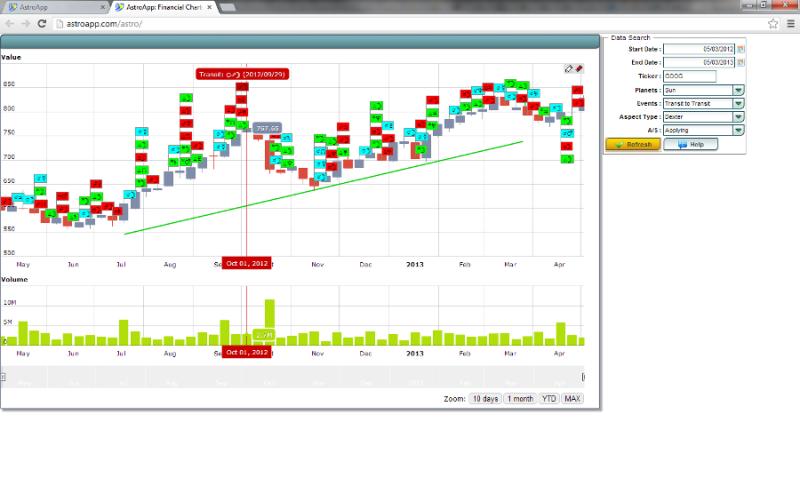
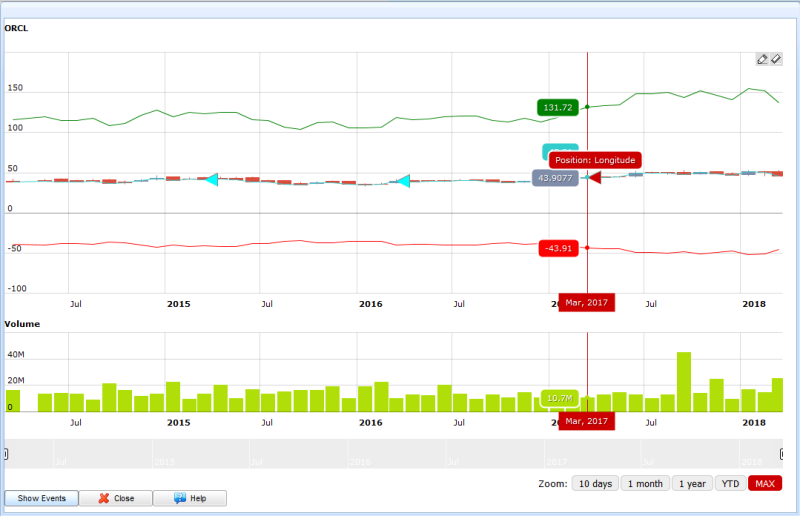
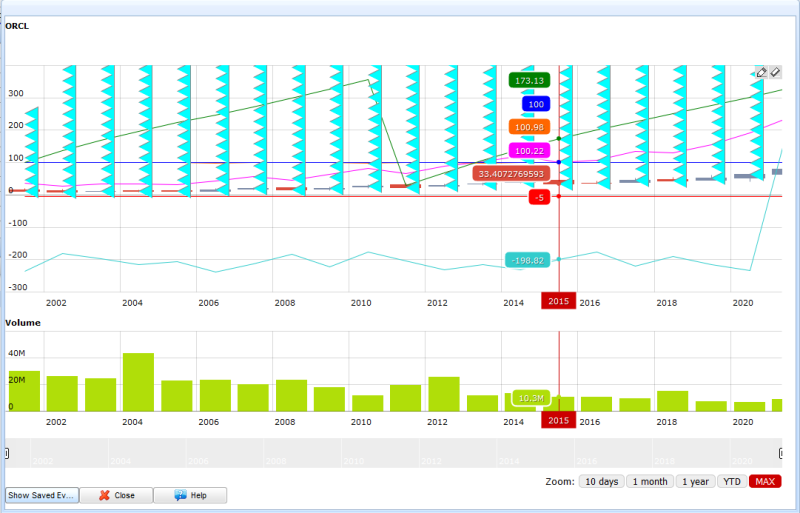
You can display prices as candlestick, OHLC or area charts, at intraday or daily resolution, and add three types of data to them:
- 93 technical indicators, from moving averages, Bollinger bands, MACD, RSI and Ichimoku to pivot points, Fibonacci levels and candlestick patterns, in any combination
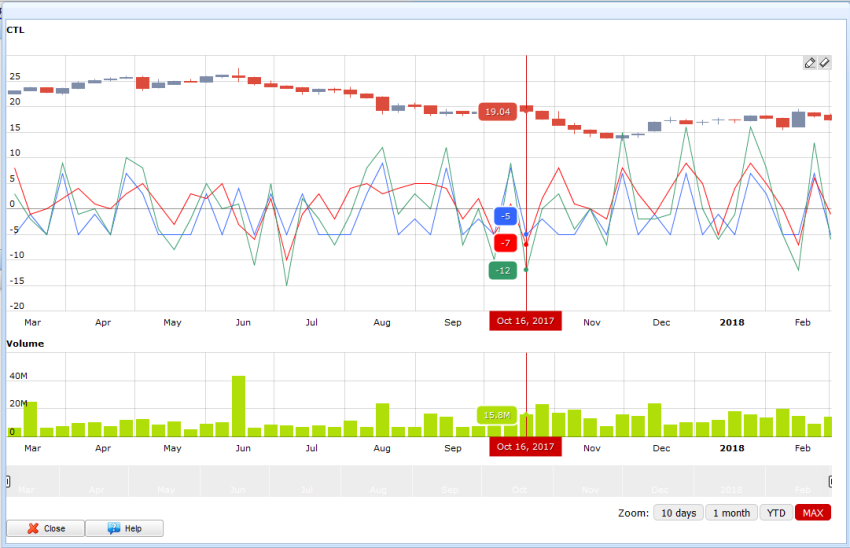
- 15 astro indicators: a planet's essential, accidental or complete dignity, its longitude, latitude, distance, speed, and speed in latitude or distance, plotted against the price
- transits and astrological events, transit to natal and transit to transit, marked along the price chart
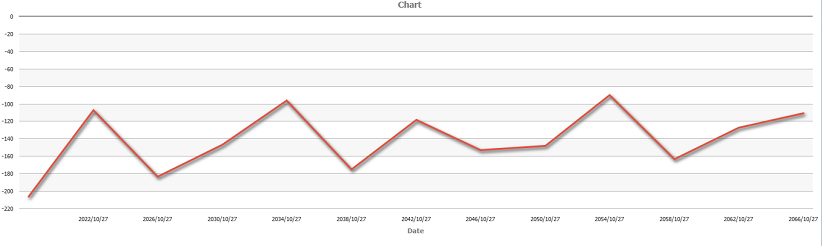
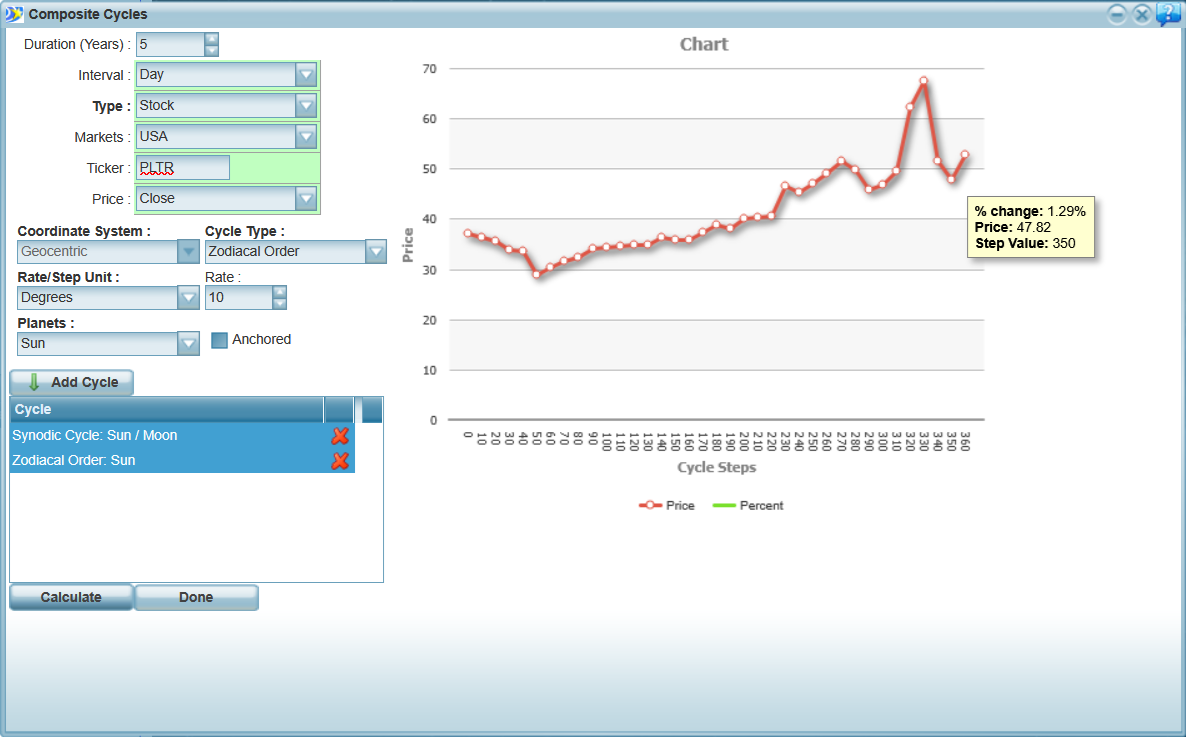
Cycle tools include composite planetary cycles compared with equity prices, in geocentric, heliocentric or topocentric coordinates, planetary cycles compared with exchange rates, the Bradley Siderograph, a US economic activity cycle index, and Treasury yields compared with astrological events. You can use the sidereal zodiac in all of them and choose from more than 40 ayanamsas. You can also see the statistical correlation between an indicator and the price in one click, and create the price wheels according to Bill Meridian's Planetary Stock Trading method for any security.
Events Research
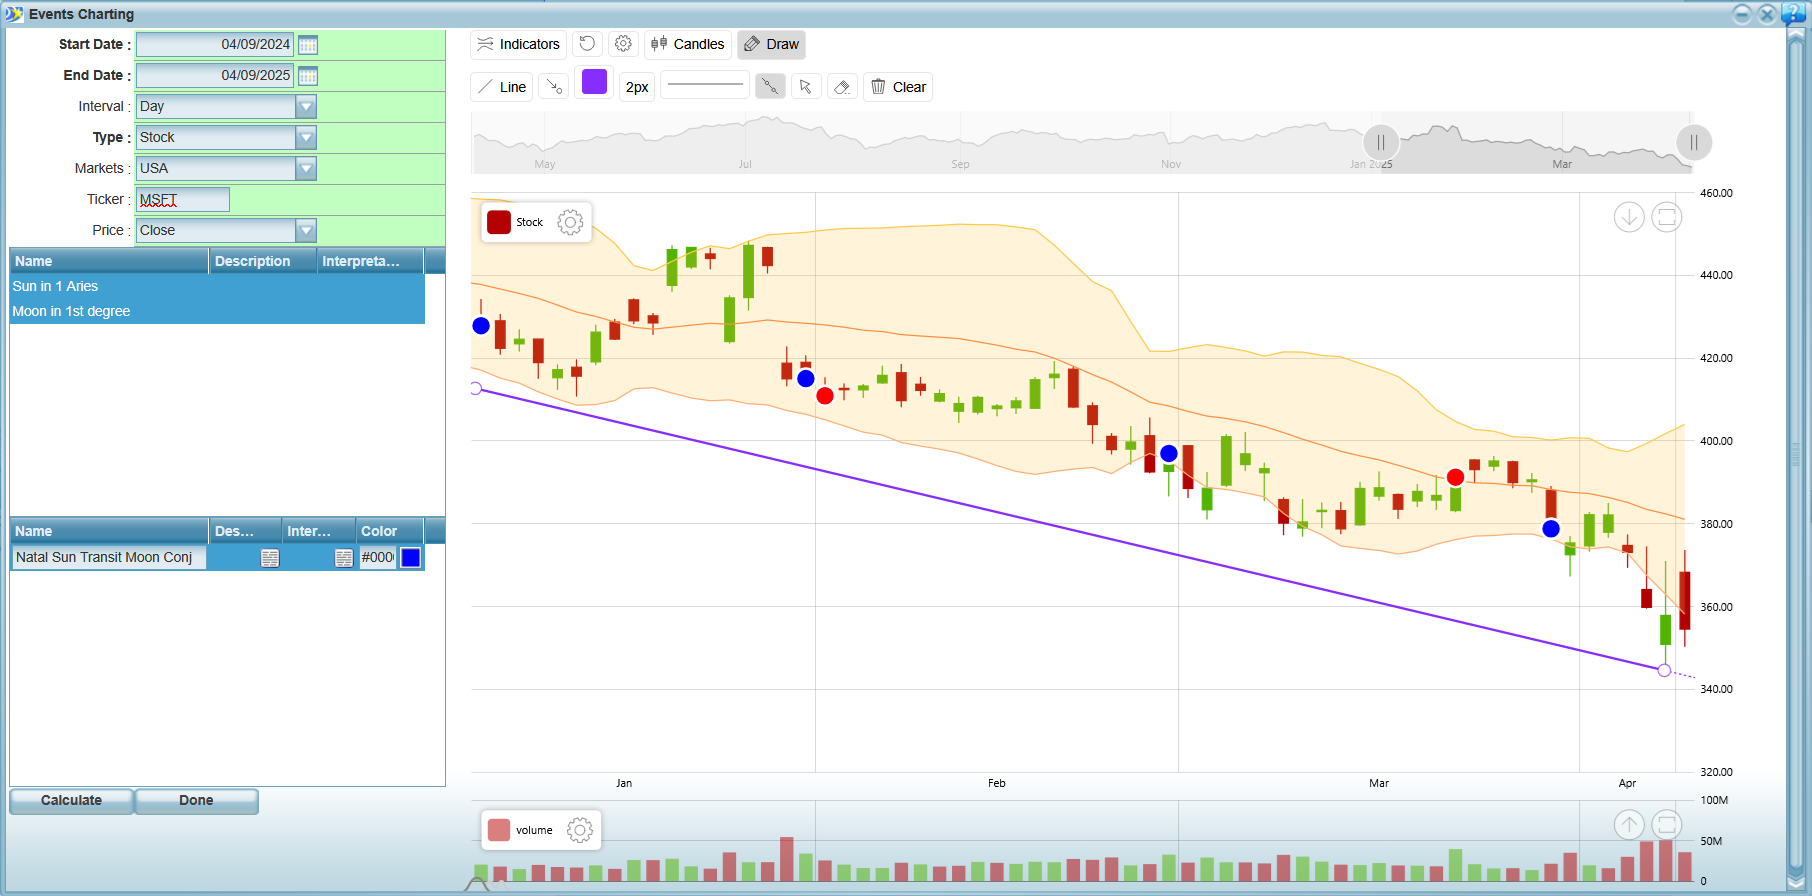
The Research module lets you test your ideas against market history. You define an astrological or astronomical event, as simple or as complex as you need, and AstroApp finds every occurrence in the price history and shows you what the price did.
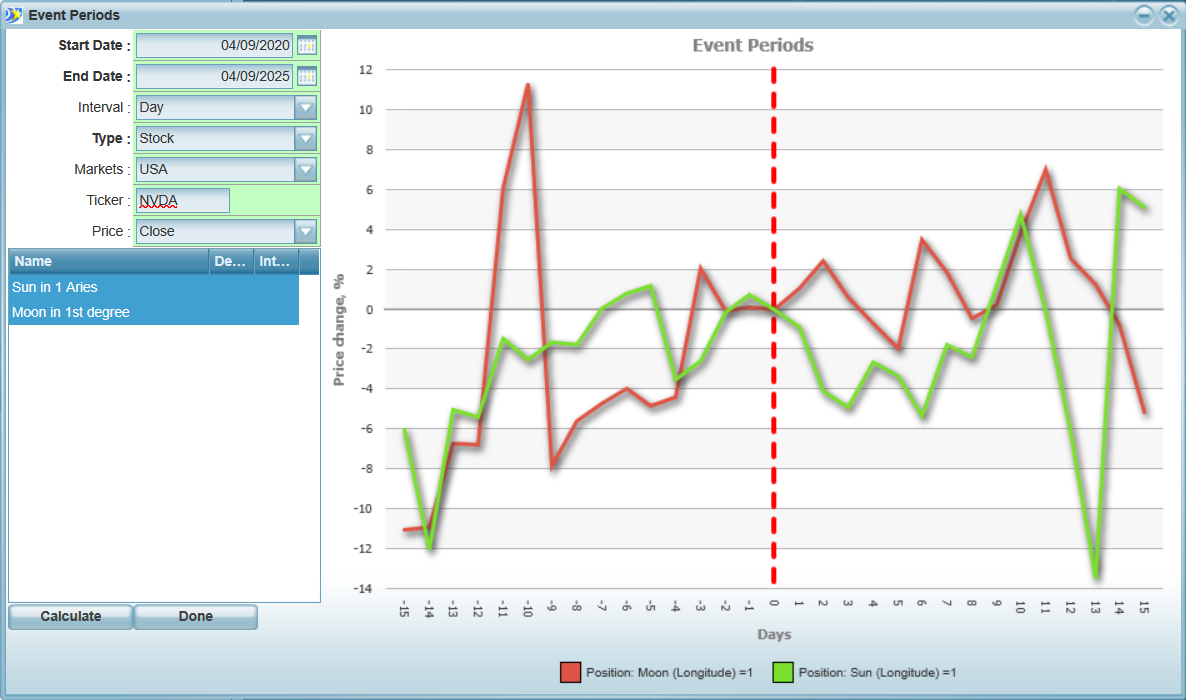
- events charting: the price movement around each occurrence, at daily or intraday resolution, with technical indicators on the same chart
- events periods: the days before and after an event, and periodic events
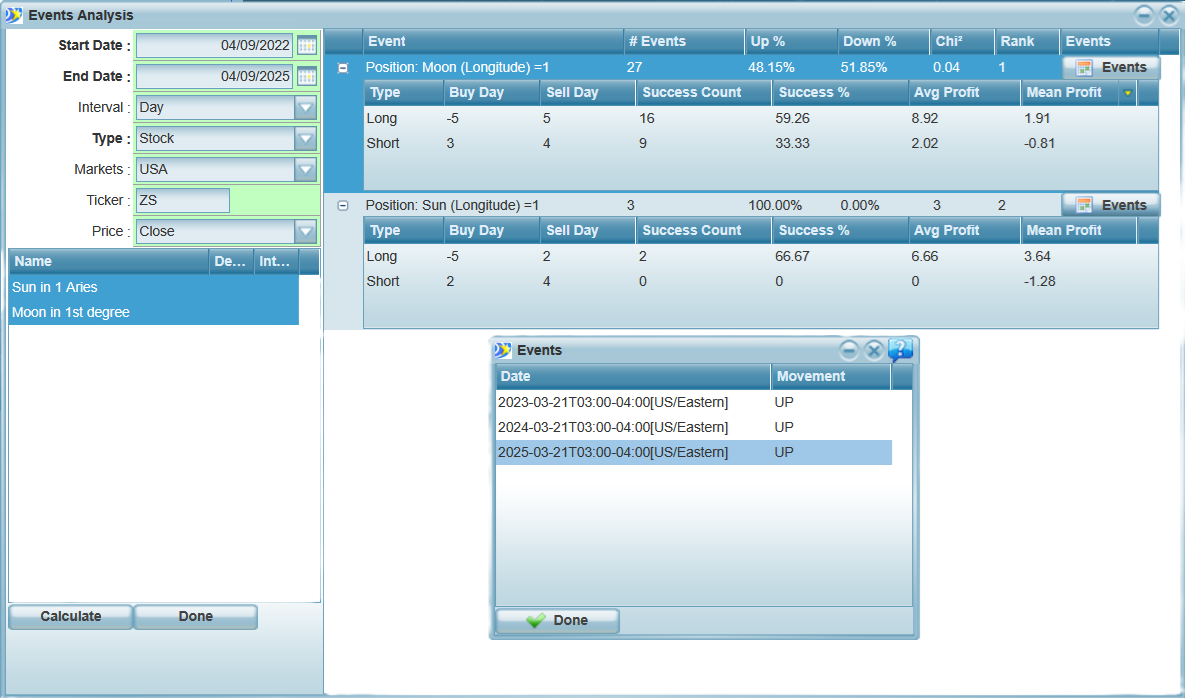
- events profitability: whether buying or selling on the event would have been profitable, for long and short strategies, for one security or a portfolio
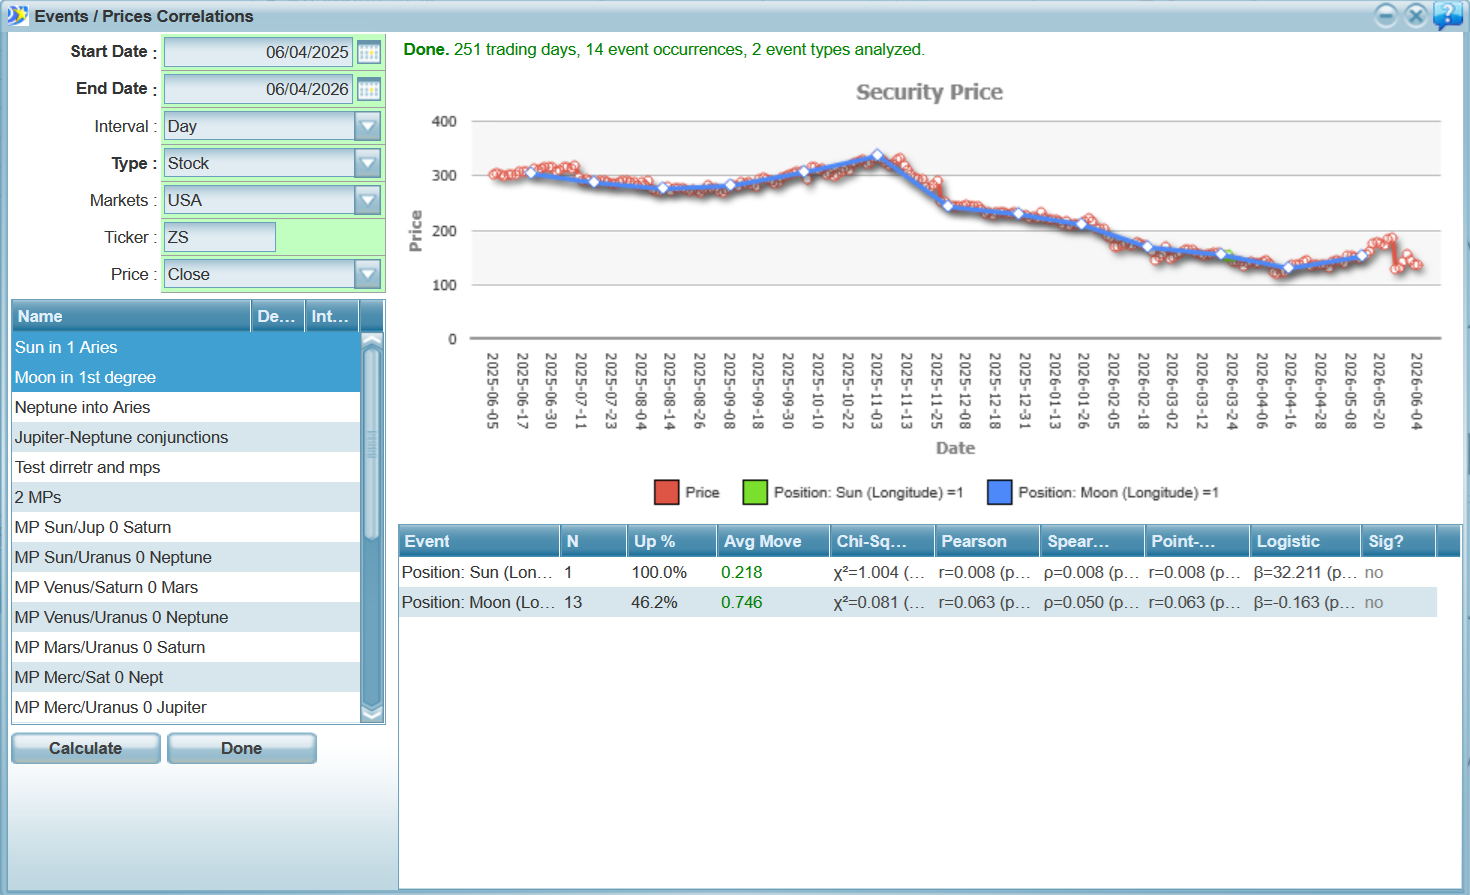
- correlations between events and prices, and a rating for each event
- filters by weekday, calendar month and the zodiac sign the event falls in
- results as tables or as line, bar, radar, area and doughnut graphs, which you can merge to study cumulative effects, save, and export to Excel or XML for further offline or AI-driven research
Earnings
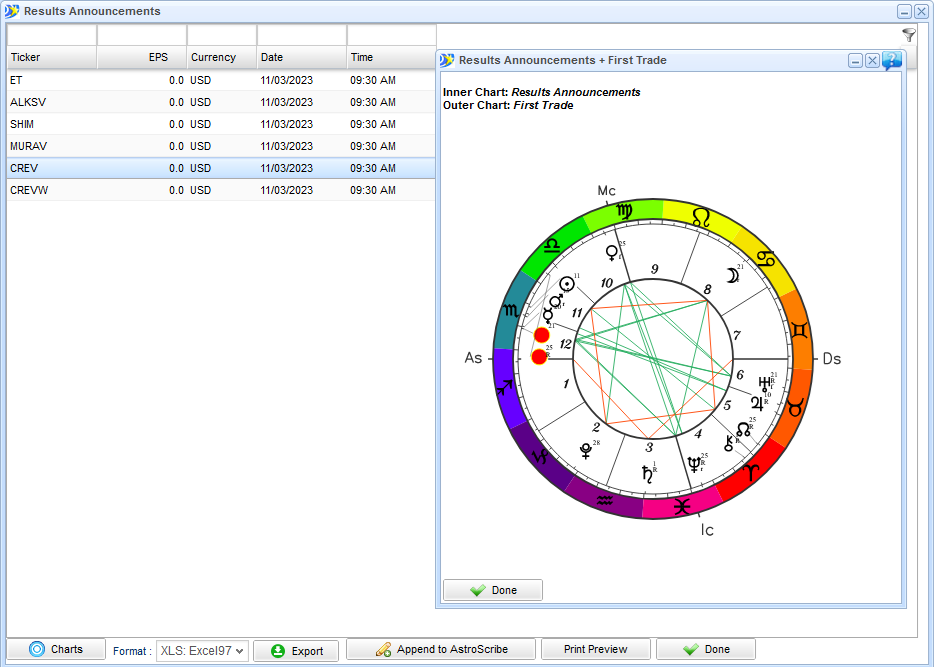
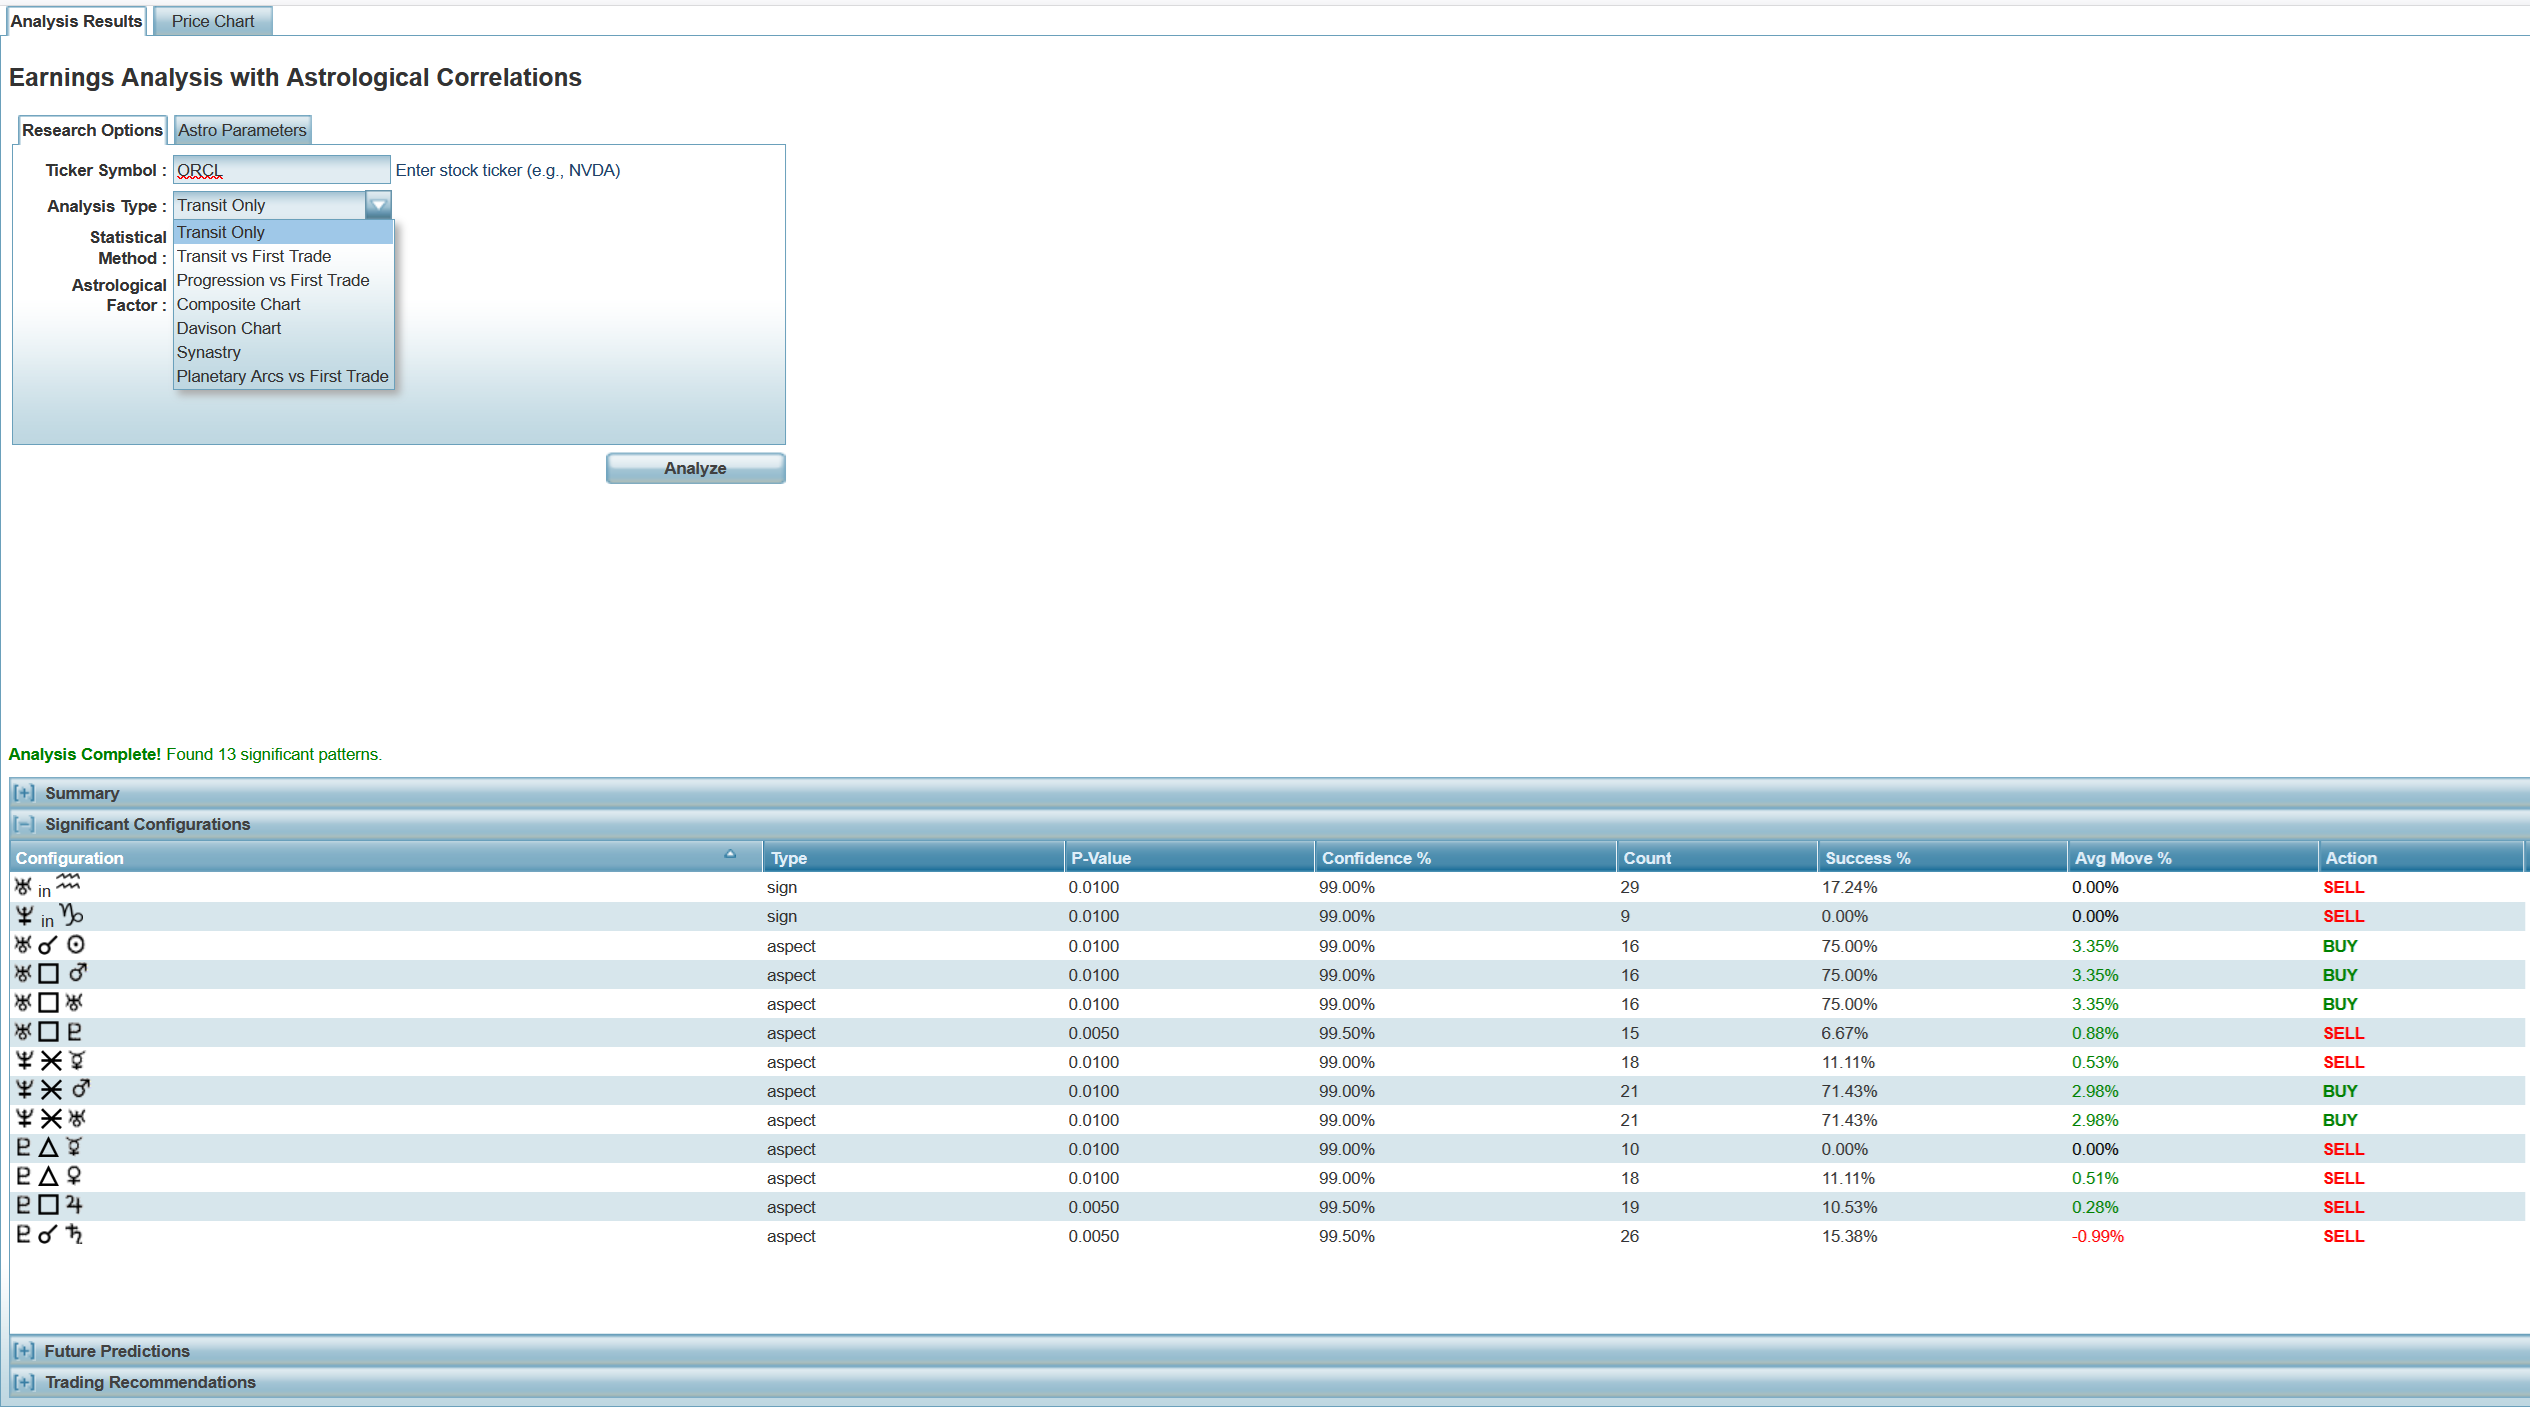
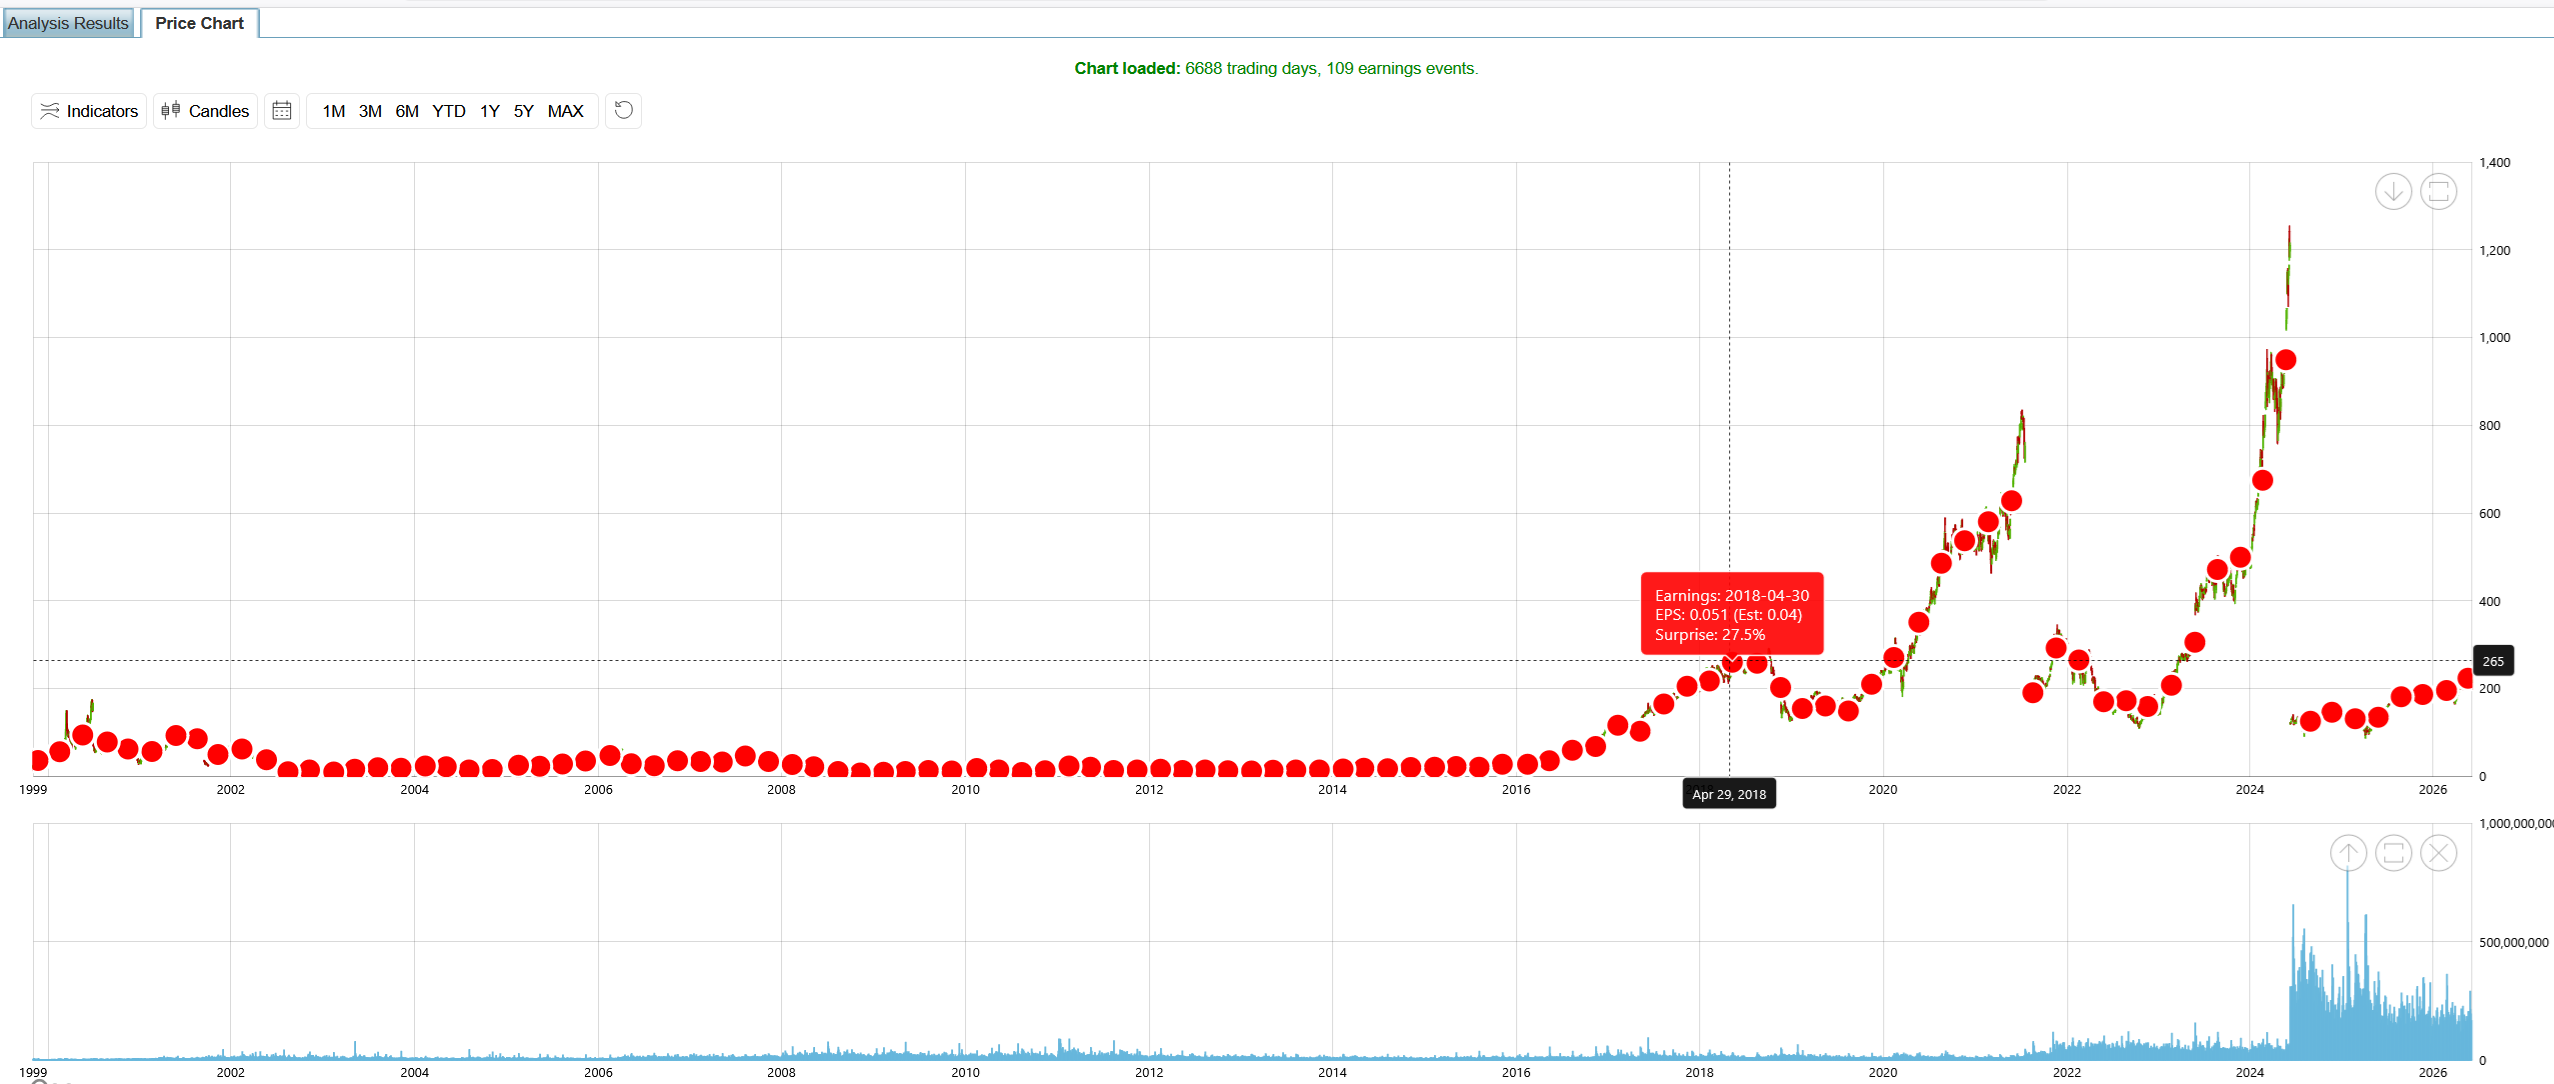
You can study quarterly earnings announcements through their own charts. The Earnings Calendar lists the announcement dates with their transits, and for each announcement AstroApp draws its chart, a bi-wheel with the first-trade chart, and the aspects between the two. You can also analyze earnings surprises and the correlation between earnings and astrological events across a security's history.
Trading Strategies
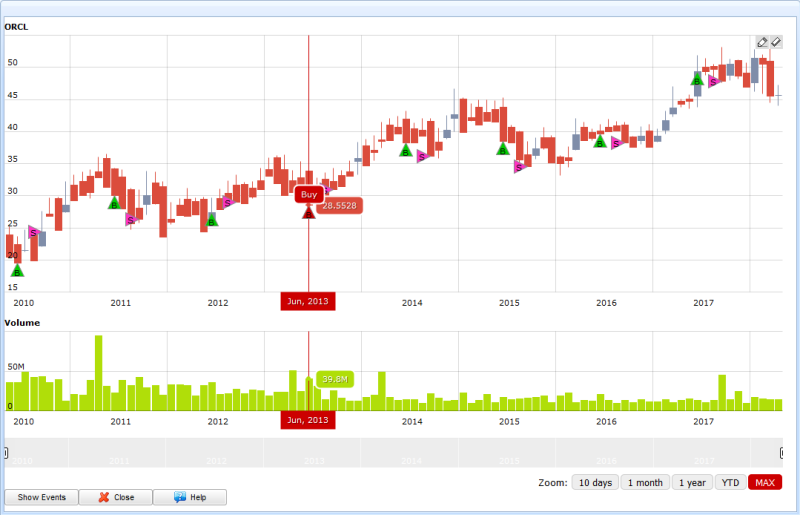
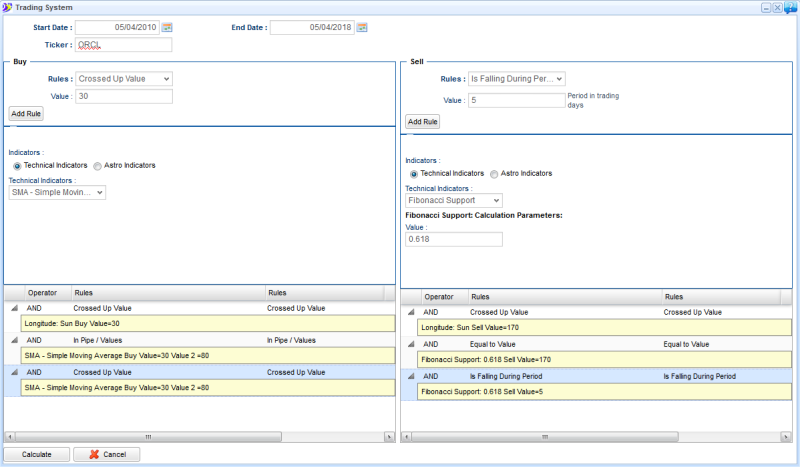
The Trading Strategies module turns an observation into buy and sell rules and shows you what those rules would have earned. You build each rule from a technical indicator, an astro indicator, or an astrological event or group of events, using 22 rule types: an indicator crossing up or down through a value or another indicator, rising or falling over a period, in a slope or a pipe, over or under a threshold, at its highest or lowest in a period, stop gain, stop loss, wait, and the event itself. You can combine rules with AND, OR, XOR and NOT. For each strategy you can see:
- the strategy's trades on the price chart, with entry and exit points
- the cash flow of the strategy over time
- profitability against buy and hold, and against your other strategies
- investment strategies defined from the research module's results and benchmarked the same way
Gann Techniques
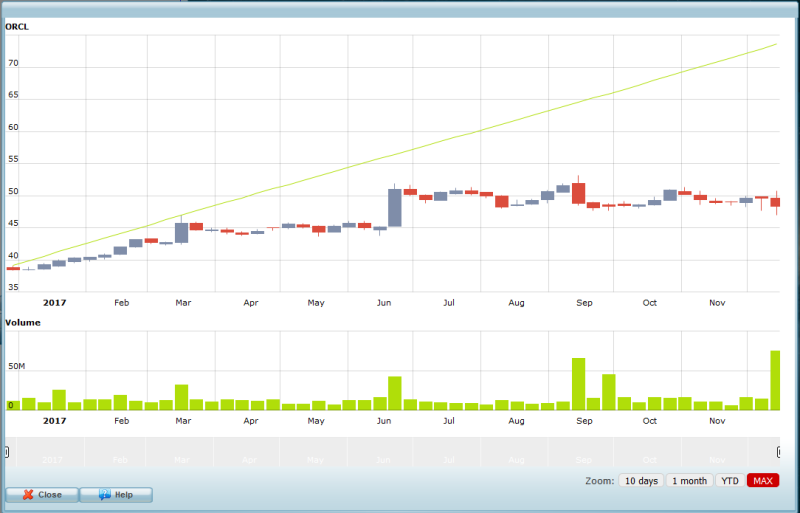
You can draw W. D. Gann's planetary support and resistance lines from transits or from the first-trade chart, on candlestick, OHLC or area price charts. The Gann tools include:
- geocentric, heliocentric and topocentric calculations, and heliocentric and geocentric lines for the same planet on one chart
- an adjustable price-to-longitude scale, and harmonics
- lines from the open, close, high, low or average daily price
- clockwise and counterclockwise projections
- Gann's Square of Nine and his time cycles
- multiple planetary lines on one chart, with the statistical correlation between the lines and the price
Portfolios and Market Movers
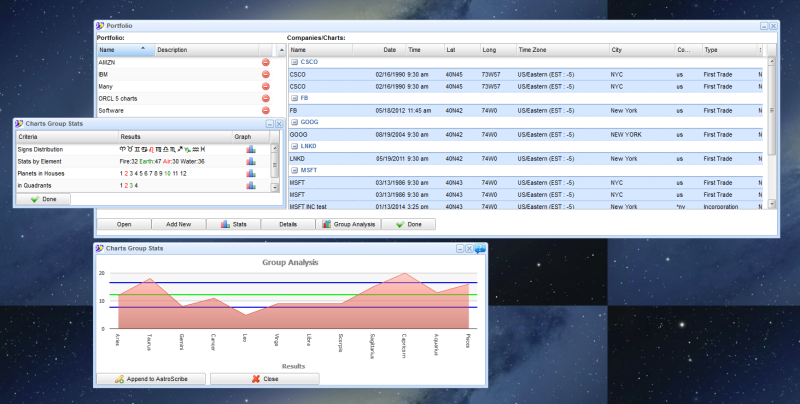
You can analyze a portfolio as a group of charts: what its first-trade charts have in common, how it performs against a set of events, and how a strategy would have handled it. The Composite Cycles module shows trading profitability across the cycles of a whole portfolio.
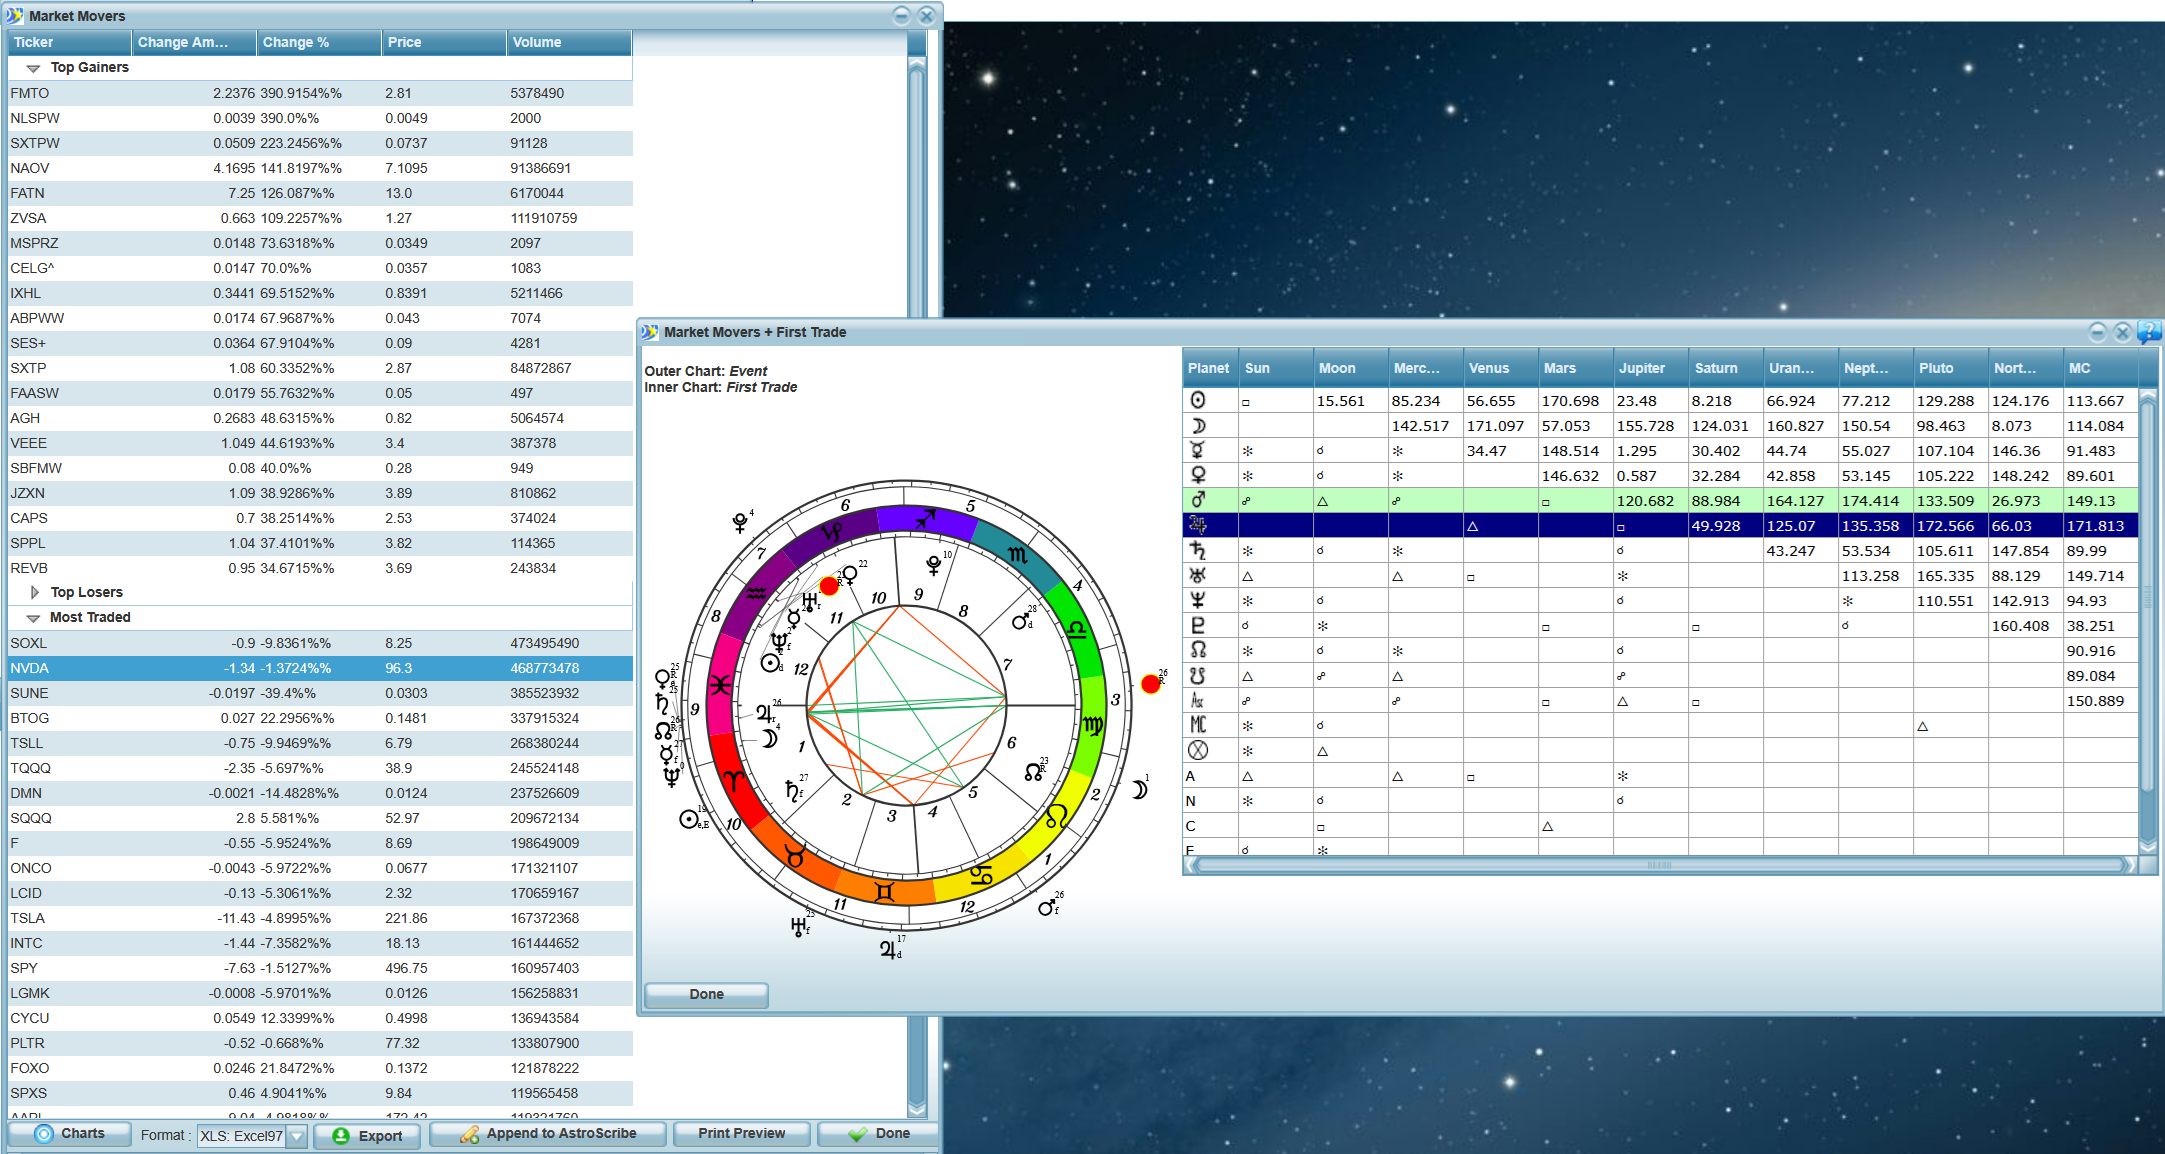
Market Movers lists the day's top gainers, top losers, most traded securities and biggest price swings. For each of them AstroApp draws a bi-wheel of the first-trade chart and the moment the security made the list, with the aspects between the two.
Scanning the First-Trade Charts
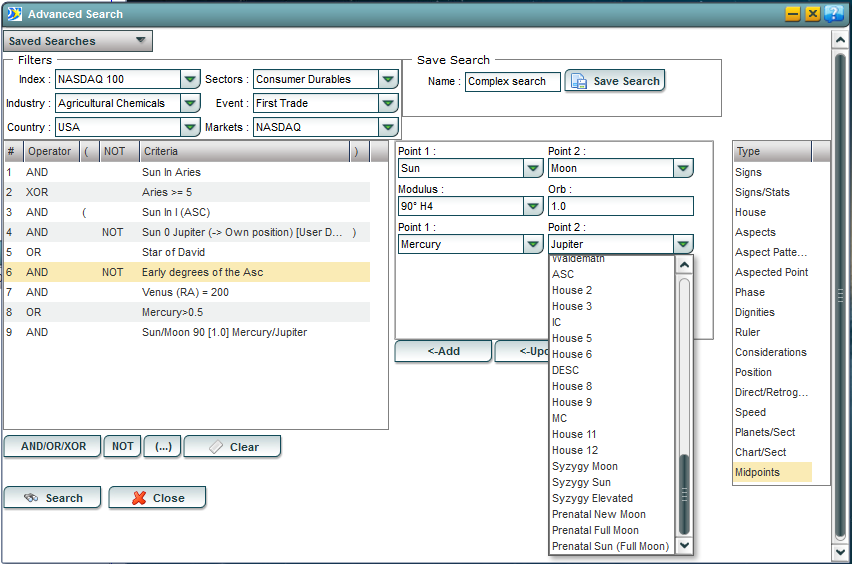
With the Advanced Search you can scan the whole first-trade database for charts that match your criteria. You can combine criteria with AND, OR, XOR, NOT and parentheses into a formula of any length and complexity, then save it for future use. Types of criteria:
- sign placements, in the tropical signs or the 13 Signs zodiac, and sign statistics
- house placements and house types
- aspects between planets, aspects to ecliptic points, midpoint aspects and 34 aspect patterns
- phases between any two objects
- dignities, rulers over specified objects, and the traditional considerations
- position in any coordinate system, speed, direction of motion
- the sect of a planet and of the chart
- the first-trade date itself
Frequently Asked Questions
Which markets can I get price data for?
You get intraday and close of day prices for the US, Indian, European, Canadian, Chinese and Brazilian stock and ETF markets, more than 25 years of daily history for 15 of them, and end-of-day rates for more than 150 currencies and more than 500 cryptocurrencies.
Can I use the sidereal zodiac in financial research?
Yes. You can use the sidereal zodiac in the research and transit modules, the indicators and the cycles, with more than 40 pre-defined ayanamsas/precession values to choose from, or your own (user-defined) value.
Can I use it for forex and cryptocurrencies?
Yes. AstroApp treats a currency pair or a cryptocurrency like any other security, so you can use the indicators, the Trading Strategies module, the research modules and the Gann techniques with it.
Can I add my own companies and charts?
Yes. You can enter or import your own first-trade charts and companies, keep them in portfolios alongside the database, and update them.
Which edition do I need for financial astrology?
Financial Gold. It includes all the financial tools and the tools of every other AstroApp edition.