Research: Chart Searches, Statistics, Group Analysis
Astrological research over your chart collections and over time, with statistics and group analysis measured against the values chance would give.
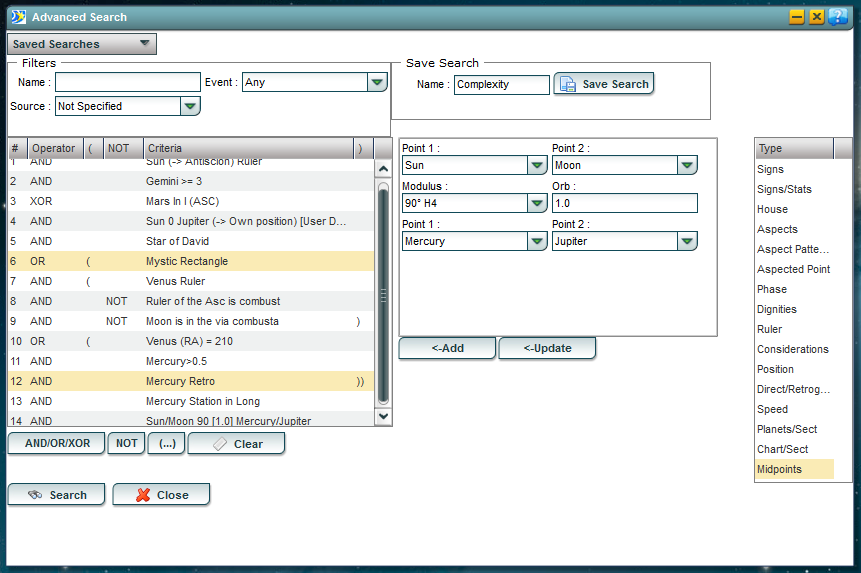
With the research tools you can search your charts and search through time. The Advanced Chart Search finds every chart in your database that matches a formula you build from placements, aspects, patterns, dignities and many other criteria, and you can use the same formulas to find what the members of a group of charts share. The transit and ingress searches work the same way over time: they find the moments when a condition holds and turn the results into calendars and timelines. You can view the statistics of any chart as graphs, and compare a group's statistics with the values chance would predict.
The Advanced Chart Search
You can build your search from 16 types of criteria, including:
- sign placements, in the tropical signs or the 13 Signs zodiac, and sign statistics, the number of objects in a sign or a type of sign
- house placements and house types, in 12 or 13 houses
- aspects between planets, aspects between planets and ecliptic points, midpoint aspects, and the 34 aspect patterns
- phases between any two objects
- dignities, the rulers over a given object, and the traditional considerations
- position in any coordinate system, geocentric, heliocentric or topocentric, as well as speed and direction of motion
- the sect of a planet and the sect of the chart
- weekdays, planetary hours and days, and lunar days according to the traditional, Vedic and Tibetan methods
- nakshatra and tropical lunar mansion placements, relative placements, Graha Drishtis, sign pairs and harmonics
You can search for an object by its own placement or by the placement of its dispositor, its first, second or third triplicity ruler, its bound ruler, its face ruler, its antiscion or its contra-antiscion. You can combine criteria with AND, OR, XOR and NOT into formulas of any depth, filter by chart name and event type, save a formula and run it again whenever you like. In the Financial Gold edition you can also search the first trade charts, with filters by index, industry, sector and market. The search also works over the mundane, world events and political events databases.
Transit and Ingress Searches
The Advanced Transit Search finds the times when transiting planets meet a condition: a position, a speed, an aspect to a planet, a midpoint or a planetary sum, an aspect to a point, a phase, a station or a change of direction. You can search in ecliptic longitude and latitude or in right ascension and declination, geocentric or heliocentric, in any harmonic. The transit to natal search adds ingresses into the natal houses, into the middle of a house or over the five-degree point before a cusp, in 12 or 13 houses, and Vedic criteria such as ingresses into navamsas.
You can combine any number of criteria, and save, rate and add your own interpretation to a search. The results appear as calendars and timelines, with the exact time of each event in your time zone or in UTC, and you can export the tables to Excel, XML and CSV.
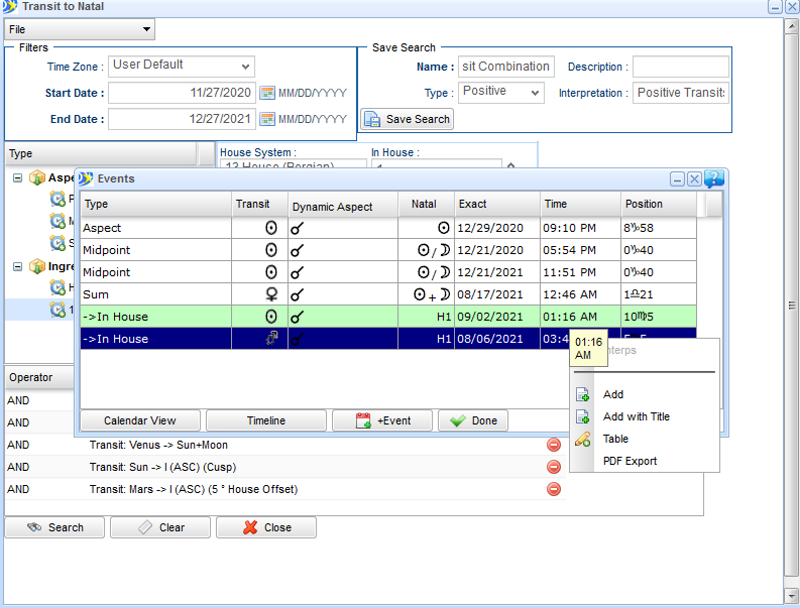
Chart Statistics
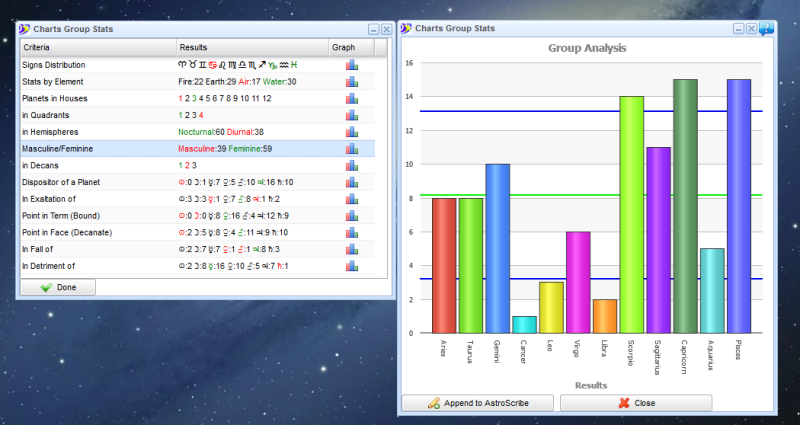
You can view 15 statistical graphs for any chart: the distribution of the planets by element, by sign rulers, exaltation, terms, faces, fall and detriment, in the signs of the 12-sign and the 13 Signs zodiacs, in the faces, in the houses, by house type, in the quadrants and hemispheres, and by masculine and feminine signs, with the house modalities. You get the same statistics for every chart a basic search finds.
Chart Group Analysis
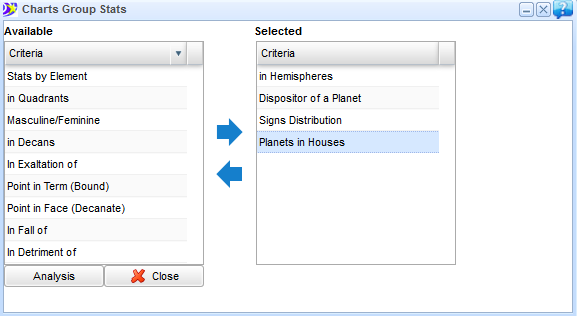
Chart Group Analysis shows what the members of a group of charts have in common and where they differ, using 13 research criteria in a set you can customize, and sign pairs. The graphs compare the group's counts with the predicted values, with the standard deviations above and below the mean, so you can tell a real tendency from chance. In the Financial Gold edition you can run the same analysis on a portfolio's first trade charts.
Frequently Asked Questions
How complex can a search be?
As complex as you need. You can combine 16 types of criteria with AND, OR, XOR and NOT to any depth, and save the formula to use again.
Can I search by an object's ruler rather than the object?
Yes. You can apply a criterion to the dispositor, the triplicity rulers, the bound ruler, the face ruler, the antiscion or the contra-antiscion of the object.
Can I search for times as well as charts?
Yes. The transit and ingress searches find the moments that meet a condition and show them as calendars and timelines.
Can I compare a group of charts with what chance would give?
Yes. Every graph shows the expected value and the standard deviations next to the group's counts.
Can I export the results?
Yes. You can export the tables to Excel, XML and CSV.
See Also
- Tutorial 12: advanced search, in the Financial Gold edition
- Forecast tools
- Financial astrology
- Mundane astrology, for the world events database